


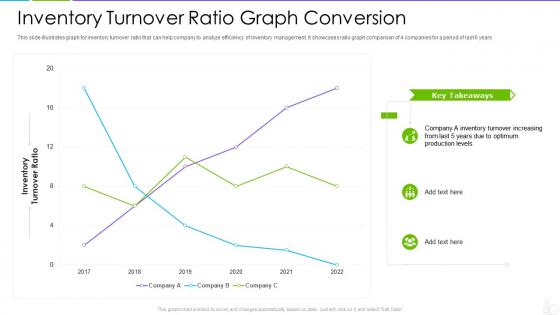
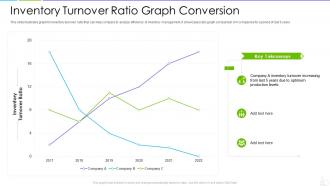
Inventory turnover ratio graph conversion




Try Before you Buy Download Free Sample Product
 Impress Your
 Audience
 100%
100% Editable
 Save Hours
 of Time


Our Inventory Turnover Ratio Graph Conversion are topically designed to provide an attractive backdrop to any subject. Use them to look like a presentation pro.
People who downloaded this PowerPoint presentation also viewed the following :
Inventory turnover ratio graph conversion with all 7 slides:
Use our Inventory Turnover Ratio Graph Conversion to effectively help you save your valuable time. They are readymade to fit into any presentation structure.





FAQs for Inventory turnover
The inventory turnover ratio measures how efficiently companies sell and replace inventory over a specific period, calculated by dividing cost of goods sold by average inventory value. This metric proves crucial for businesses because it reveals operational efficiency, cash flow management, and market demand alignment, with retail chains, manufacturing companies, and distributors using it to optimize stock levels, reduce carrying costs, and ultimately enhance profitability while maintaining competitive responsiveness.
Companies calculate inventory turnover ratio by dividing cost of goods sold by average inventory value, typically using beginning and ending inventory figures from financial statements. This metric helps retailers, manufacturers, and distributors assess stock efficiency, identify slow-moving products, and optimize purchasing decisions, ultimately enabling better cash flow management and reduced carrying costs.
Factors influencing inventory turnover ratios include product shelf life, seasonal demand patterns, supply chain complexity, customer buying behaviors, and industry-specific regulations. Manufacturing companies typically experience slower turnover than retail sectors, while grocery stores and fashion retailers achieve higher ratios through perishable goods and trend cycles, ultimately requiring tailored inventory strategies for optimal efficiency.
Seasonal trends significantly impact retail inventory turnover ratios by creating fluctuating demand patterns, with peak seasons accelerating turnover while off-seasons slow movement rates. Retailers in fashion, electronics, and home goods typically experience higher ratios during holidays and seasonal transitions, requiring strategic inventory planning and flexible supply chains to maintain optimal turnover levels, ultimately delivering improved cash flow and reduced carrying costs throughout varying demand cycles.
Businesses can improve inventory turnover through demand forecasting, just-in-time ordering, ABC analysis for prioritizing high-value items, supplier relationship optimization, and regular inventory audits. These strategies streamline operations by reducing carrying costs, minimizing stockouts, and enhancing cash flow, with many retailers and manufacturers finding that strategic inventory management ultimately delivers competitive advantage and improved profitability.
A low inventory turnover ratio signals potential cash flow problems, excess stock tying up working capital, demand forecasting errors, and inefficient inventory management practices. This creates significant challenges for businesses through increased storage costs, product obsolescence risks, and reduced profitability, with many retail and manufacturing organizations finding that addressing turnover issues ultimately enhances operational efficiency and competitive positioning.
Inventory management software enhances turnover ratios by providing real-time tracking, automated reorder points, demand forecasting, and performance analytics across all inventory categories. These systems streamline stock optimization by reducing excess inventory, minimizing stockouts, and improving demand prediction accuracy, with many retailers and manufacturers finding that automated inventory control ultimately delivers faster turnover cycles and enhanced operational efficiency.
Companies balance inventory turnover with customer satisfaction by implementing demand forecasting systems, strategic safety stock levels, supplier relationship optimization, and real-time inventory tracking technologies. Through advanced analytics and just-in-time practices, retailers and manufacturers minimize carrying costs while maintaining product availability, ultimately delivering improved cash flow and enhanced customer experiences without stockouts.
FIFO (First-In, First-Out) uses older inventory costs for calculations while LIFO (Last-In, First-Out) uses recent costs, creating different turnover ratios during price fluctuations. FIFO typically shows higher turnover ratios in inflationary periods by matching lower historical costs against current sales, while LIFO presents more conservative ratios, with many manufacturing and retail companies finding FIFO better reflects actual inventory flow patterns.
Economic conditions significantly influence inventory turnover ratios through consumer demand fluctuations, supply chain disruptions, and cost pressures that affect purchasing patterns and stock management strategies. During economic downturns, retailers and manufacturers often experience slower turnover as customers reduce spending, while inflationary periods can accelerate turnover as businesses minimize holding costs, ultimately requiring adaptive inventory strategies for sustained operational efficiency.
Companies can benchmark their inventory turnover ratio by accessing industry reports from trade associations, consulting firms like McKinsey or Deloitte, and financial databases such as Bloomberg or Reuters. These resources enable businesses to compare performance against sector averages, identify optimization opportunities, and implement strategic improvements in procurement, demand forecasting, and supply chain management, ultimately delivering competitive advantage through enhanced operational efficiency.
Excess inventory significantly impacts cash flow by tying up working capital that could be invested elsewhere, while also increasing storage costs, insurance expenses, and risk of obsolescence. This creates a dual burden where companies face reduced liquidity and declining profitability, with many retail and manufacturing businesses finding that streamlined inventory management ultimately delivers improved cash conversion cycles and enhanced operational efficiency.
Key metrics to analyze alongside inventory turnover ratio include days sales in inventory, gross margin percentage, stockout frequency, carrying costs, and seasonal demand patterns. These complementary indicators work together by revealing inventory efficiency, profitability impacts, and customer satisfaction levels, with many retail and manufacturing organizations finding that this comprehensive approach enables better demand forecasting, optimized stock levels, and ultimately enhanced operational performance.
A high inventory turnover ratio enhances company agility by reducing excess stock, freeing up capital for strategic investments, and enabling faster response to market changes and customer demands. This streamlined approach allows businesses to minimize storage costs, reduce obsolescence risks, and pivot quickly when introducing new products, ultimately delivering improved cash flow and competitive responsiveness in dynamic markets.
Grocery stores, restaurants, and fashion retailers typically experience the highest inventory turnover ratios due to perishable goods and seasonal demand, while automotive dealerships, furniture stores, and luxury goods retailers show the lowest ratios. These variations reflect industry-specific factors like product shelf life, customer purchase frequency, and seasonal cycles, with many companies increasingly using these benchmarks to optimize inventory management, reduce carrying costs, and enhance operational efficiency across their supply chains.
-
Best Representation of topics, really appreciable.
-
Great designs, really helpful.