


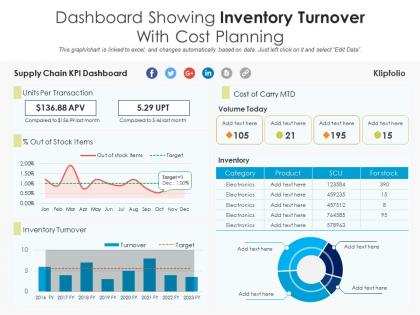
Dashboard showing inventory turnover with cost planning




Try Before you Buy Download Free Sample Product
 Impress Your
 Audience
 100%
100% Editable
 Save Hours
 of Time


Our Dashboard Showing Inventory Turnover With Cost Planning are topically designed to provide an attractive backdrop to any subject. Use them to look like a presentation pro.
People who downloaded this PowerPoint presentation also viewed the following :
Dashboard showing inventory turnover with cost planning with all 2 slides:
Use our Dashboard Showing Inventory Turnover With Cost Planning to effectively help you save your valuable time. They are readymade to fit into any presentation structure.
FAQs for Dashboard showing inventory turnover
Key metrics include inventory turnover ratio, days sales in inventory, stock-out frequency, gross margin by product category, and ABC analysis classifications. These metrics enable managers to identify slow-moving inventory, optimize reorder points, and reduce carrying costs, with many retail and manufacturing organizations finding that comprehensive dashboards ultimately enhance cash flow and operational efficiency.
Businesses can customize their inventory turnover dashboards by incorporating industry-specific metrics, seasonal patterns, supplier lead times, regulatory requirements, and product lifecycle stages. Retail companies focus on fast-moving consumer goods and seasonal fluctuations, while manufacturing firms emphasize raw materials and work-in-progress tracking, with healthcare organizations prioritizing expiration dates and compliance monitoring, ultimately delivering enhanced operational efficiency and strategic decision-making capabilities.
Real-time data transforms inventory turnover dashboards by providing immediate visibility into stock movements, demand fluctuations, and supply chain disruptions, enabling instant decision-making and proactive inventory adjustments. This immediacy allows retailers and manufacturers to respond quickly to market changes, prevent stockouts, optimize reorder points, and minimize carrying costs, ultimately delivering enhanced operational efficiency and competitive advantage in increasingly dynamic markets.
Inventory turnover dashboards enable businesses to identify slow-moving items through velocity analytics, aging reports, turnover ratio tracking, and comparative performance metrics across product categories. These tools highlight products with extended shelf time, low rotation rates, and declining demand patterns, allowing companies to implement targeted markdown strategies, optimize purchasing decisions, and reallocate warehouse space, ultimately improving cash flow and operational efficiency.
Effective inventory turnover visualization techniques include line charts for trend analysis, heat maps for category performance, bar charts for period comparisons, gauge charts for target tracking, and waterfall charts for variance analysis. These visualizations enhance decision-making by highlighting slow-moving inventory, seasonal patterns, and reorder points, with many retailers finding that strategic dashboard combinations ultimately streamline inventory management and reduce carrying costs.
Inventory turnover directly impacts profitability by reducing carrying costs, minimizing obsolescence risks, and freeing up working capital for strategic investments. The dashboard reflects this through key metrics like turnover ratios, profit margins per category, and cash flow indicators, enabling businesses to identify slow-moving stock, optimize procurement cycles, and ultimately enhance operational efficiency while maximizing return on inventory investments.
Effective inventory turnover dashboard solutions include Tableau, Power BI, QuickBooks Enterprise, NetSuite, SAP Analytics Cloud, and specialized tools like Zoho Inventory and TradeGecko. These platforms streamline data visualization, automate reporting workflows, and integrate seamlessly with existing ERP systems, enabling businesses across retail, manufacturing, and distribution sectors to optimize stock levels, reduce carrying costs, and enhance operational efficiency.
Seasonal trends significantly impact inventory turnover metrics by creating fluctuating demand patterns that accelerate turnover during peak periods and slow it during off-seasons, requiring adjusted benchmarks and forecasting models. Retail businesses, hospitality companies, and consumer goods manufacturers increasingly use seasonal-adjusted dashboards to distinguish between temporary seasonal dips and genuine performance issues, ultimately enabling more accurate inventory planning and strategic resource allocation decisions.
Common challenges include data integration from multiple systems, ensuring real-time accuracy, training staff on dashboard interpretation, and aligning metrics with business objectives. Many organizations find that while initial setup requires significant coordination between IT and operations teams, these dashboards ultimately streamline inventory management, reduce carrying costs, and enhance decision-making capabilities across departments.
Companies leverage inventory turnover dashboards for demand forecasting by analyzing historical turnover patterns, identifying seasonal trends, tracking product velocity changes, and monitoring stockout frequencies across different SKUs. These insights enable businesses to predict future demand more accurately, optimize procurement schedules, and adjust inventory levels proactively, with many retailers finding that data-driven forecasting reduces excess inventory by 20-30% while improving service levels.
An inventory turnover dashboard supports supply chain management by providing real-time visibility into stock movement patterns, identifying slow-moving products, tracking seasonal demand fluctuations, and highlighting supplier performance metrics. These insights enable supply chain managers to optimize procurement schedules, reduce carrying costs, and prevent stockouts, with many retail and manufacturing organizations finding that data-driven inventory decisions ultimately enhance operational efficiency and customer satisfaction.
Businesses should integrate ERP systems, point-of-sale data, warehouse management systems, supplier databases, and demand forecasting tools into their inventory turnover dashboard for comprehensive accuracy. These integrated data sources streamline real-time visibility by combining sales velocity, stock levels, and supplier lead times, with many retail and manufacturing organizations finding that centralized dashboards ultimately deliver faster decision-making and reduced carrying costs.
Businesses can utilize historical data in inventory turnover dashboards to identify seasonal trends, predict demand fluctuations, optimize stock levels, and make informed procurement decisions. Through analyzing past performance patterns, companies in retail, manufacturing, and distribution streamline inventory management, reduce carrying costs, and enhance cash flow, while ultimately gaining competitive advantage through data-driven strategic planning that minimizes stockouts and overstock situations.
A low inventory turnover ratio indicates excess stock, tied-up capital, increased storage costs, and potential obsolescence risks, while also suggesting weak demand or ineffective sales strategies. This presents both challenges and opportunities, with many organizations finding that addressing low turnover through demand forecasting improvements, pricing adjustments, and strategic inventory rebalancing ultimately delivers enhanced cash flow and operational efficiency.
Shared inventory turnover dashboards enhance cross-departmental collaboration by providing unified data visibility, real-time performance metrics, and standardized KPIs across sales, procurement, and finance teams. Through centralized analytics, departments can coordinate purchasing decisions, align promotional strategies, and optimize stock levels collaboratively, with many organizations finding that shared dashboards reduce communication gaps and accelerate decision-making processes.
-
Great product with highly impressive and engaging designs.
-
Use of different colors is good. It's simple and attractive.