


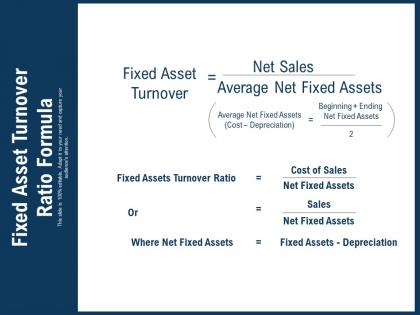
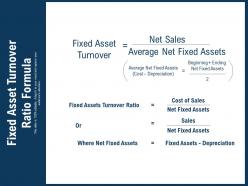
Fixed asset turnover ratio formula




Try Before you Buy Download Free Sample Product
 Impress Your
 Audience
 100%
100% Editable
 Save Hours
 of Time


Go through at a canter with our Fixed Asset Turnover Ratio Formula. Gains will come galloping in.
People who downloaded this PowerPoint presentation also viewed the following :
Fixed asset turnover ratio formula with all 2 slides:
Gains are assured with our Fixed Asset Turnover Ratio Formula. You can bet blindly on it.

FAQs for Fixed asset
So basically, Fixed Asset Turnover shows how well you're using big stuff like equipment and buildings to make money. You just divide your sales by average fixed assets. Higher numbers mean you're getting more sales per dollar spent on that expensive equipment - which is obviously what you want. Honestly, I think this metric is pretty clutch because it'll tell you if you bought too much stuff or if what you have isn't pulling its weight. Compare it to your competitors too. That way you'll know when it's time to upgrade or maybe sell off some equipment that's just sitting there.
Honestly, there's two main ways to tackle this. Either pump up your revenue or trim down your assets. I'd start by actually using the equipment you have better - run it more hours, cut downtime, maybe even add shifts if you've got the demand. Sell off anything that's just sitting there not making money. Leasing new stuff instead of buying keeps your numbers lighter too. Track which assets are actually working hard versus the lazy ones - you'll be surprised what you find. Do a quick audit of what you own versus what's actually earning its keep.
So you just need two things - net sales and average net fixed assets. Sales is easy, just your revenue minus returns and discounts. For the other part, grab your net fixed assets from the beginning and end of the period, add them up and divide by two. Net fixed assets is basically your property and equipment minus depreciation - what it's actually worth on paper. Income statement has your sales, balance sheet has the asset stuff. Pretty straightforward once you know where to look, honestly the hardest part is just finding the right line items.
So this ratio is all about your big expensive stuff - buildings, machinery, equipment. It measures how well you're using those assets to make money. Pretty different from other ratios that look at overall financial health or profits. Most companies don't think about it much, but if you're in manufacturing or any business with tons of equipment, it's actually super helpful. Shows whether all that expensive gear is worth what you paid for it. Unlike debt ratios or ROE, this one's narrow - just focused on whether your major investments are pulling their weight.
So basically, companies like retailers and software firms get crazy high ratios because they don't need much physical stuff to make money. Manufacturing and utilities? Totally different story - they're stuck buying expensive factories and power plants just to function. Honestly, it's kinda unfair to compare them directly. A tech company will always look "better" on this metric than an oil refinery, but that doesn't mean the refinery sucks at business. Just compare companies in the same industry, otherwise you're comparing apples to... I dunno, oil rigs.
So the Fixed Asset Turnover Ratio basically tells you if you're getting decent returns from your big-ticket stuff - equipment, buildings, whatever. When it starts dropping, that's your cue to either pump up sales or maybe dump some dead weight assets. Honestly, I'd compare yours to what others in your industry are doing. Track it over a few quarters too. If you're constantly behind competitors, you might be sitting on too much expensive equipment that isn't pulling its weight. Sometimes companies get asset-happy and forget the whole point is generating revenue, you know?
Honestly, that ratio's kinda misleading on its own. It ignores whether assets are old junk or shiny new equipment - and newer stuff makes a company look worse even if it's a smart investment. Also, comparing a tech company to like a steel manufacturer is pointless since their asset needs are completely different. High turnover sounds great until you realize the company's making zero profit on those sales. I always check it against ROA and profit margins too, plus what's normal for that industry. Otherwise you're just looking at one piece of a much bigger puzzle.
So basically, good economic times = higher sales through the same equipment, which makes your ratio look awesome. But recessions? Sales tank while you're still stuck with all those expensive assets just sitting there. It's honestly pretty unfair to management - they look terrible even when they're doing everything right. I always tell people to compare against competitors during the same time period instead of looking at your own company's past performance. Like, comparing your 2023 numbers to 2019 doesn't really tell you much since the whole world was different then.
So tech investments will definitely help your Fixed Asset Turnover Ratio, but here's what actually happens. You'll see a temporary dip first because you're adding expensive equipment to your fixed assets before the magic kicks in. Once it does though? Your existing assets become way more productive - more revenue from the same base, which is what this ratio tracks. Modern tech usually pays for itself through better output and less downtime. I'd probably check your numbers quarterly after any big investment so you know when you hit breakeven. The automation stuff especially makes a huge difference once it's running smoothly.
So the depreciation method you pick totally changes your Fixed Asset Turnover Ratio. Basically, it affects the net book value of your assets - that's what goes in the denominator. Accelerated methods like double-declining balance write assets down way faster, so your denominator gets smaller and boom - higher ratio. Straight-line keeps things steadier over time. But here's what's kinda crazy about it - your actual efficiency hasn't changed at all! You're just moving numbers around on paper. That's why I always tell people to check what depreciation methods companies are using before comparing ratios. Makes a huge difference honestly.
Yeah totally! It's actually perfect for comparing companies since they'll have similar asset setups. Just make sure you're staying within the same industry - like don't compare a manufacturing company to some tech startup, that's pointless. What I'd do is grab maybe 4-5 competitors and look at their ratios over a few years instead of just one year. That way you can see who's actually crushing it with their assets vs who's just having a lucky quarter. The trend stuff matters way more than a single number anyway.
Actually, inventory won't change your Fixed Asset Turnover Ratio at all. Inventory's a current asset - the ratio only cares about fixed stuff like buildings and equipment. Yeah, inventory management hits other ratios (inventory turnover, duh), but fixed asset turnover is just measuring how well you're squeezing revenue out of your long-term assets. Your machinery, facilities, that kind of thing. So if you want to boost this specific ratio, focus on getting more sales from the equipment you already have. Inventory tweaks won't move the needle here - kinda weird how these ratios work, right?
So when that ratio goes up over time, your company's basically getting more bang for its buck from fixed assets - pretty solid sign. Going down though? Could be a few things. Maybe you're not using assets well, or you just dropped serious cash on new equipment that hasn't started paying off yet (happens all the time). Context matters big time here. Are you expanding or just cruising? I'd definitely check what your competitors are doing and figure out what's actually driving those changes. Numbers by themselves don't tell the whole story, you know?
High ratios usually mean the company's crushing it with revenue from their assets - solid for investors. But it could also mean they're being cheap on new equipment, which bites you later. Low ratios? Either they're wasting assets or just dropped tons of cash on upgrades that haven't kicked in yet. Honestly, both extremes are kinda misleading on their own. You've gotta check what their competitors are doing and see if the trend's going up or down over a few years. That's how you figure out if management actually knows what they're doing with the money.
So this ratio shows how well companies turn their big-ticket stuff (buildings, equipment, etc.) into actual sales. Just divide net sales by average fixed assets - higher numbers mean they're doing better. Manufacturing companies usually score lower than service businesses, which makes sense when you think about it. What I really like checking is how the trend looks over a few years, plus how they stack up against competitors. It's honestly one of the easier ways to spot if management's wasting money on assets that aren't pulling their weight.
No Reviews