





 0 Comment
 Customer Reviews

A refrigerator that sends you a text to tell you that you are low on milk. A programmable bulb that gets dark as you go to sleep. An assembly line in which the machines report on their maintenance requirements. Enter the new reality: IoT Dashboards are a place where your smart device dashboard becomes a command center of a smart environment.
It is the smart home dashboard that customizes your home environment, or an IoT device management dashboard that scans the performance of thousands of industrial IoT sensors. These dashboards make your data live. They could monitor IoT in the real-time to see which data of IoT are visualized and all the necessary metrics of IoT on one comprehensive dashboard are provided to the business increasing their insight, offering more control, and enhancing efficiency.
Whether you are monitoring environmental sensors or handling city infrastructures, an IoT dashboard makes the invisible visible and the future manageable, translating a potentially complex world into one that is clear and understandable.
Learn the Top 10 IoT templates with samples and examples to help you out of the complex theory of IoT.
In order to enable you to see and realize your IoT Dashboard, SlideTeam has provided you with 100% modifiable PPT Templates that leave your data alive in the presentation. These templates are ideal to visualize your IoT devices dashboard, to monitor changes in real time, and present your important performance indicators using an IoT metrics dashboard.
Whether you need to map out smart homes, industrial systems, or even a large IoT network, these templates provide a professional method of viewing device relationships, device activity, and display data flow to make your IoT data fast, actionable, and presentation-ready.
View our list of Top 10 Best PPT Templates to see an illustrated IoT cloud.
Template 1: Dashboard for IoT Device
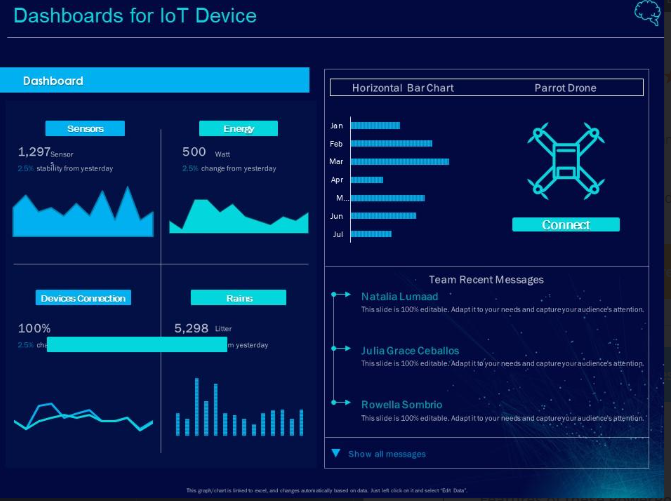
The PowerPoint Template illustrates a connected devices dashboard to provide a smooth, real-time monitoring of IoT. It shows identified active sensors, stability, energy used, and more. The layout entails a horizontal bar chart and a Parrot Drone that is linked. Download now to simplify complex IoT data to easy-to-read charts consisting of actionable information.
Template 2: Dashboard for IoT Telecommunication Customer Service
This presentation slide features a dashboard on IoT performance metrics that are ideal in customer care in telecommunications. It contains important KPIs such as Customer Lifetime Value, repurchasing rate and correlation of the complaint status as open, on-the-way, and resolved. In addition to this, the PPT visual furnishes other measures involving customer retention rate, the average contact resolution, and the number of subscribers, retention, and churn rate every month. This template allows for the monitoring of IoT performance effectively. Download now!

Template 3: Dashboard for Monitoring IoT Connected Cars Performance
This PPT Design provides a visualization of the overall dashboard that tracks the performance of IoT-connected cars. It provides real-time IoT information and exact tracking of IoT performance. In addition to this, the key information given on the slide relates to the vehicle condition, including fuel level , RPM , voltage , tyre pressure, and engine capacity. In addition to that, it emphasizes other functions such as the vehicle speed (Miles/Hr), throttle position, air intake air flow, & real-time location. Download now for making informed decisions to maintain vehicles effectively.

Template 4: IoT-Based Smart Factory Dashboard to Monitor Performance
This PowerPoint Layout presents an IoT-based smart factory dashboard built for detailed IoT performance tracking and actionable IoT insights. The slide monitors factories, production lines, machines, and users, with a total production of units. It also focuses on key metrics, including downtime, behind plan, actual performance, OEE, actual production, scrap, and quality. Additionally, the design shows factory-wise stats covering locations like Atlanta, California, Ohio, Brazil, Poland, and Germany. Save it today to drive efficiency and reduce operational risks.

Template 5: Dashboard for Management of Healthcare IoT Applications
In this presentation diagram, there is a healthcare IoT control panel that is meant to monitor clients and prompt real-time health information. The template shows the crucial information about Jessica such as heart rate, temperature, oxygen level, and blood pressure. In addition, it follows other vital blood measurements like Vitamin E, HDL, LDL blood levels, sodium, and glucose. It is perfect for constant monitoring, quick interventions, and intelligent care improvement choices because of IoT.

Template 6: Dashboard for IoT Water Management Business
This PPT Diagram outlines a user interface of IoT that would support the efficient management of water in business. It introduces some important indicators like the consumption each month, the limit reached, the water level predicted next month, and the water level currently. Additionally, PowerPoint design possesses elements such as the ability to click to switch the engine off, trend patterns consumed (daily to yearly), which is under real-time control. There is also an outline of water quality indicators. This presentation graphic is value adding in terms of decision making, cost management, and sustainability of resources.

Template 7: Key Indicator Dashboard for IOT Data Visualization
This PowerPoint Graphic displays a dashboard that allows visualization of important traffic statistics using IoT solutions. It monitors the data of traffic loop 1 and traffic loop 2, and in detail, the patterns of weekly estimates, observations, predictions, and anomalies are further shown. In addition, the layout provided in the presentations includes hourly traffic flow and even average car speed, which does not exceed 70 minutes. The PowerPoint framework contributes to the simplification of the complicated IoT data visualization and allows traffic authorities and city designers to achieve the best flow, see the anomalies, and take proactive decisions.

Template 8: IoT Device Management Dashboard for the Automotive Industry
The presented illustration demonstrates an IoT application dashboard designed to be efficient at managing IoT devices relevant to the car business. Included uniquely in the PowerPoint diagram are the Toyota Camry, Volkswagen Passat, Mazda 6, Ford Mustang, and Nissan Maxima, which also use distinctive versions of software. Furthermore, the PPT template addresses the most significant metrics: active devices and total events, divided into custom events and network requests. The presentation slide allows automating the work of IoT in the automotive industry and tracking in real-time.

Template 9: Dashboard Matrix Exhibiting Top IoT Benefits
This PPT Framework demonstrates a dashboard matrix of the best IoT advantages in the major business categories. It demonstrates how IoT can make efficiency rise, increase the efficiency of operations, and boost productivity. Besides, it also focuses on excellent growth in yield, enhanced manufacturing capacity, and excellent business cost. IoT also assists in the enhancement of quality, removes human error, and improves customer satisfaction. This PowerPoint design brings a clear visualization of the measurable effect of IoT to carry through on the strategic decisions.

Download This Presentation Now
Template 10: IoT Device Monitoring Dashboard to Analyse Security Issues
The PowerPoint Slide contains the IoT device monitoring dashboard that will examine the security questions on several sites. The presentation draws attention to 20 sites in total, 4 of which are offline, one site contains offline equipment, and 2 of them are security issues. It also indicates that users can search by name and location of the sites, and network setups. It improves security monitoring and allows for acting accordingly, immediately, and knowingly.

Harness Insight through IoT Dashboards
The actual value of IoT is that the information about billions of machines can be tracked, visualized, and acted on. An easy-to-read data-visualization dashboard lets you have understanding, control, and effectiveness. Through proper equipment, your IoT strategy does not simply work; it is powerful and future-proof.
Find out the Top 10 IoT Applications Templates to demonstrate real-life scenarios.
FAQs on IOT Dashboard
What is an IoT dashboard and how does it work?
An IoT dashboard is a view in an IoT platform that gives users a view to monitor, interact with, and manage connected devices. It provides centralized insight into the data captured by the sensors and such IoT devices so that one can monitor performance, identify issues, and thus make better decisions.
What are the key features of an IoT monitoring dashboard?
The users of the IoT monitoring dashboard are generally to observe performance, analyze information, and attend to problems on an almost real-time basis, while they watch their increasing IoT ecosystem. The users can accomplish all these tasks with the support of the functionalities of the dashboard concerning real-time data visualization of IoT, remote connections, automation, notification, cloud connectivity, AI solutions, and scalability.
How to design a custom IoT dashboard for smart devices?
Well, first, requirements have to be laid down for the user and devices, along with connectivity established by the user. Secondly, the dashboard needs to be selected, its interface developed, and then it should integrate data visibility and alerts. Finally, the dashboard is tested and implemented.


