


BSC Report Powerpoint Presentation Slides





Try Before you Buy Download Free Sample Product
 Impress Your
 Audience
 100%
100% Editable
 Save Hours
 of Time


Improve organizational performance with the help of our content ready BSC report PowerPoint Presentation Slides. Increase focus on strategy and result by utilizing balanced scorecard PPT visuals. Identify and improve various internal functions of a business with the help of performance management PowerPoint layouts. Also, showcase the need for BSC such as the focus on future performance, improving the communication of vision and strategy, etc. Discuss the use of a balanced scorecard such as to support the payments of incentives to individuals etc. Mention four perspectives of traditional balanced scorecard which are Financial, customer, internal process, and learning and growth by utilizing balanced scorecard PowerPoint slideshow. Depict an organization’s strategy by using balanced scorecard strategy map PPT layouts. You can also highlight the steps to create a strategy map by using marketing strategy PowerPoint layout. Thus, create an effective business strategy by employing this balanced scorecard report PPT Presentation.
People who downloaded this PowerPoint presentation also viewed the following :
Content of this Powerpoint Presentation
Slide 1: This slide introduces BSC Report. State Your Company Name and begin.
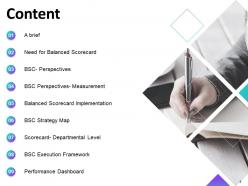
Slide 2: This slide displays the Content of the presentation.
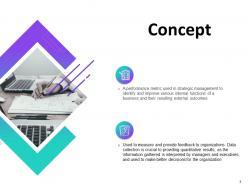
Slide 3: This slide displays the Concept. A performance metric used in strategic management to identify and improve various internal functions of a business and their resulting external outcomes.
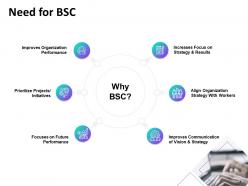
Slide 4: This slide describes the Need for BSC.
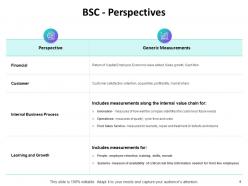
Slide 5: This slide depicts BSC - Perspectives.
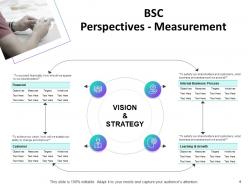
Slide 6: This slide represents BSC Perspectives - Measurement with- Vision and Strategy.
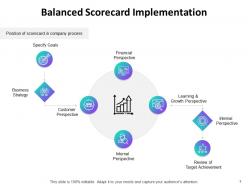
Slide 7: This slide displays the Balanced Scorecard Implementation.
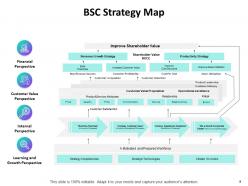
Slide 8: This slide depicts BSC Strategy Map.
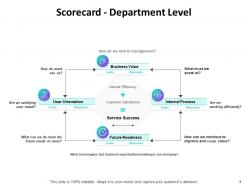
Slide 9: This slide describes Scorecard - Department Level.
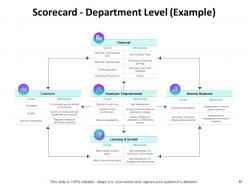
Slide 10: This slide showcases the example of Scorecard - Department Level.
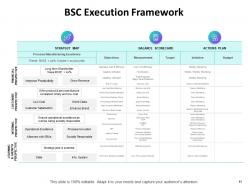
Slide 11: This slide depicts BSC Execution Framework.
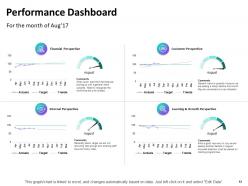
Slide 12: This slide showcases Performance Dashboard.
Slide 13: This is BSC Report Icons Slide.
Slide 14: This slide is titled as Additional Slides for moving forward.
Slide 15: This is Our Mission slide with related imagery.
Slide 16: This is About Us slide to showcase company specifications.
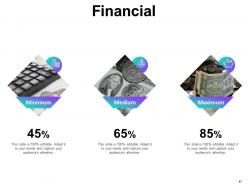
Slide 17: This is Financial slide. Showcase finance related stuff here.
Slide 18: This is Our Team slide with names and designation.
Slide 19: This slide is titled as Post it Notes. Post your important notes here.
Slide 20: This is four years Timeline slide.
Slide 21: This is Thank You slide with address, email address and contact number.
BSC Report Powerpoint Presentation Slides with all 21 slides:
Use our BSC Report Powerpoint Presentation Slides to effectively help you save your valuable time. They are readymade to fit into any presentation structure.






FAQs for BSC Report
Think of a BSC report as getting the full picture of how your company's doing, not just the money stuff. You're tracking four areas: financials, customers, internal processes, and learning/growth. Honestly, most companies get way too obsessed with revenue and miss everything else. The cool part? You can see problems coming instead of just reacting when things go bad. Different parts of your business connect in ways you wouldn't expect. Start by picking metrics in each area that actually matter for your strategy - don't just track random stuff because it's easy to measure.
Honestly, middle management is where these things usually die, so tackle that first. Start with one department as a pilot - trust me on this. Define your four perspectives (financial, customer, internal stuff, learning & growth) but actually show people how their daily tasks connect to the big picture. That cause-and-effect mapping is clutch. Don't just create scorecards and call it done though. You've got to cascade them down through departments and tie metrics to real compensation. Oh, and review quarterly or it'll just collect dust. The whole thing falls apart if people can't see what's in it for them.
So BSC reports cover four main areas - financial stuff like revenue and profit margins, customer metrics (satisfaction, retention, market share), internal processes (cycle times, quality measures), and learning & growth (employee satisfaction, training hours, innovation). Here's the thing though - stick to maybe 3-5 KPIs per section max. Otherwise you'll get totally buried in numbers and lose sight of what actually moves the needle. Pick metrics that connect to each other. Like, employee training should eventually boost customer satisfaction, which then improves your financials. Makes sense, right? Oh, and definitely figure out your strategic goals first, then work backwards to find the right KPIs. Way easier that way.
So basically a BSC report takes your big-picture strategy and breaks it down into actual numbers that make sense. You get clear targets across four areas - money stuff, customer happiness, internal processes, and team development. Each department can see exactly how their work connects to everything else. Finance tracks costs, marketing watches satisfaction scores, operations focuses on improving processes - that kind of thing. What's cool is departments stop working against each other because they finally see how their goals affect everyone else's. I'd start by doing quarterly reviews with all your department heads. That's where you'll catch the best opportunities that span multiple teams.
Honestly, charts and dashboards make BSC reports way more engaging than endless spreadsheet rows. People actually look at them instead of glazing over. You'll spot trends and performance gaps instantly - way better than hunting through numbers. Plus you can show cool connections, like how customer satisfaction links to revenue over time (which honestly surprised me when I first saw it visualized). Pick the right chart type for each metric though. Keep things clean and simple first - you can always add complexity later if it actually helps tell the story.
Here's how I'd handle BSC reports: Set up monthly or quarterly reviews to compare your actual numbers against targets across all four areas. Track trends over time instead of just looking at single snapshots - way more useful that way. When you start, grab baseline metrics so you know where you began. Dashboard views with red/yellow/green indicators are honestly a lifesaver for quick status checks. Most companies I've seen do automated alerts when things drift too far off track. That way you catch problems early instead of scrambling later. Oh, and watch for patterns in your variances - they'll show if you're actually moving toward your goals or just spinning wheels.
Honestly, data quality is gonna be your biggest headache - everything's scattered across different systems and it's a mess. Don't try measuring everything at once either, you'll drown in metrics. Pick like 4-5 solid KPIs per area and stick with those. Getting leadership on board early is crucial, otherwise they'll just ignore whatever you build later. Oh and automate the data collection from day one because manual updates? Yeah, that never lasts. I learned that the hard way at my last job. Start with just one section of the scorecard and expand once you've got that dialed in.
Honestly, digital tools are game-changers for BSC reports. No more drowning in spreadsheets or dealing with those awful static printouts from 2005. You can automate data collection now and build dashboards that actually look decent. Real-time visualizations, automated KPI tracking, cloud access - your team can check metrics whenever they want. Mobile dashboards are clutch too since executives love checking numbers on their phones during meetings (weird flex but okay). I'd start by figuring out what's eating most of your time right now. That's where you'll see the biggest payoff from going digital.
Look, BSC reports basically break down the metrics by what each level actually needs to track. Operations folks focus on process stuff - cycle times, training completion, that kind of thing. Middle management? They're watching customer satisfaction and internal efficiency to keep their departments running smooth. Senior execs care about the financial results and whether everything aligns strategically. What's cool is everyone can see how their work connects to bigger company goals instead of just doing their own thing in a vacuum. Honestly, just figure out which BSC area matters most for your role and use those numbers for your next quarterly planning session.
Monthly or quarterly works best for BSC updates. Monthly's great if you need to spot trends fast, quarterly if your metrics don't move that quickly. Honestly, I've watched so many teams do annual updates and their scorecards become totally pointless. Match your timing to how fast things change in your business - and how quickly you can actually move the needle on what you're measuring. Fast-paced industry? Go monthly. Not sure? Start quarterly, then tweak it if you're missing problems until it's too late to fix them.
So basically, traditional systems only care about money stuff - revenue, profits, the usual. BSC is way broader though. It looks at four areas: finances, customers, how your processes work, and whether your team's actually growing. Here's the thing - most companies just stare at what already happened instead of figuring out what's coming next. BSC flips that around with leading indicators. Think of it like... checking your bank balance tells you where you are, but tracking spending habits and customer happiness shows where you're headed. My advice? Start by figuring out which non-financial stuff actually moves the needle on your bottom line.
BSC reports are honestly pretty brilliant for tracking what employees actually care about - yeah, there's financial metrics, but also learning opportunities, how smoothly processes run, customer happiness, all that good stuff. When people can see how their daily work fits into the bigger picture through those four perspectives, they get way more engaged. I've seen it happen. Use the data to spot skill gaps and build training around what's actually needed. The real magic happens when you share these reports openly with your teams and have genuine conversations about growth - not those awkward performance review talks nobody likes.
Manufacturing and healthcare kill it with BSC stuff - those clear connections between what you do and what you make just click for them. Financial services and retail aren't far behind either. Winners keep it ridiculously simple though. Like 15-20 KPIs tops, not some massive spreadsheet nightmare. They actually train people to read the scorecards (crazy concept, right?), update quarterly instead of forgetting about them, and tie everything back to their main strategy goals. Honestly just pick one area to focus on first. You can always build out from there once you've got that piece working smoothly.
Set up quarterly check-ins instead of waiting for your annual review - way more effective. When the market shifts, your metrics need to shift too. I can't tell you how many companies I've watched cling to useless KPIs just because they're comfortable with them. Get input from different teams and actually pay attention to what's really happening day-to-day. Your BSC isn't meant to be permanent. It should change as your business does. Oh, and schedule that first quarterly review for next month before you forget about it entirely.
Skip the boring presentations - get your team working with actual BSC data right away. Hands-on workshops are where the magic happens. Walk through how metrics tie to real business outcomes and why that matters for decisions. Role-playing works surprisingly well too, people retain so much more when they're problem-solving. Monthly "data story" sessions are gold - have different team members present what they found. Regular touchpoints for discussing reports and sharing insights make it collaborative instead of feeling like school. Honestly, I've seen teams that were totally lost with BSC stuff become pretty sharp once they start digging into real scenarios together.
-
Innovative and Colorful designs.
-
Visually stunning presentation, love the content.
-
Wonderful templates design to use in business meetings.
-
Innovative and Colorful designs.