

Business Intelligence Flowchart Depicting Data Warehouse Profiling




Try Before you Buy Download Free Sample Product
 Impress Your
 Audience
 100%
100% Editable
 Save Hours
 of Time


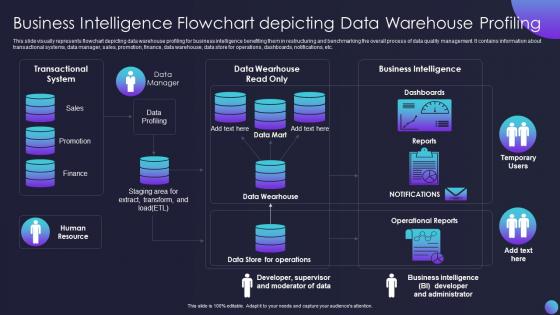
This slide visually represents flowchart depicting data warehouse profiling for business intelligence benefiting them in restructuring and benchmarking the overall process of data quality management. It contains information about transactional systems, data manager, sales, promotion, finance, data warehouse, data store for operations, dashboards, notifications, etc.
People who downloaded this PowerPoint presentation also viewed the following :
Business Intelligence Flowchart Depicting Data Warehouse Profiling with all 6 slides:
Use our Business Intelligence Flowchart Depicting Data Warehouse Profiling to effectively help you save your valuable time. They are readymade to fit into any presentation structure.





FAQs for Business Intelligence Flowchart Depicting
Look, you're basically playing detective with your data before building anything. Check for missing stuff, duplicates, weird outliers - get a feel for what you're working with. Think of it like... I don't know, checking your fridge before deciding what to cook? You'll also want to spot how different data sources connect and find inconsistencies that'll bite you later. Honestly, I've seen people skip this step and regret it big time. Profile everything first, then build. Trust me, it saves so much pain down the road.
So profiling is like the discovery part - you're just poking around your data to see what you've actually got. Patterns, weird distributions, how tables connect, that kind of stuff. Quality assessment is different though - that's where you're judging if your data actually meets your standards. I always think of it like profiling asks "what IS this mess?" and quality assessment is more "okay, how screwed am I?" You can't really jump straight to quality checks because you need that baseline first. Otherwise you're just guessing at problems. The profiling stuff actually tells you which quality tests make sense to run.
For enterprise stuff, you'll probably run into **Informatica Data Quality**, **Talend**, or **IBM InfoSphere QualityStage**. **Great Expectations** is my go-to for open-source - free and works great with Python. **Apache Griffin** is decent too. Your non-tech team members might like **Alteryx** better since it's more visual. SAS is still out there but feels kinda old school now, honestly. Cloud-wise, **AWS Glue DataBrew** and **Google Cloud Dataprep** are solid if you're already using those platforms. I'd start with Great Expectations though - can't beat free, and the documentation is actually readable for once.
Think of data profiling as scoping out your data before jumping into ETL work. You'll catch all the weird formatting issues and quality problems upfront instead of discovering them when everything breaks later. Sample your source data first - seriously, just do it. The patterns and relationships you find will help you write way better transformation logic that actually handles edge cases. I learned this the hard way after spending way too many late nights debugging production jobs that should've worked perfectly. It's basically like checking the ingredients before you start cooking, except boring and with more spreadsheets.
Start with the basics - completeness rates, null percentages, and duplicate records. Those'll give you a solid foundation. Query execution times and table scan rates matter too, especially if performance becomes an issue later. Honestly, I'd avoid going crazy with metrics right away. It gets messy fast! Data freshness timestamps are pretty useful though, and definitely watch referential integrity between your tables. Oh, and track data distribution patterns and outliers - they're great for catching weird stuff early. Build your dashboard piece by piece instead of trying to monitor everything at once. You can always add fancier profiling later.
Honestly, profiling is a lifesaver when auditors show up - and trust me, they always do. You'll have actual proof your data meets compliance standards instead of scrambling around looking for random reports. It automatically spots sensitive stuff that needs GDPR or HIPAA protection, tracks accuracy over time, shows data lineage. The documentation pretty much handles itself. Instead of panicking during audit season, you can catch problems early and actually demonstrate you're maintaining standards. Plus you get ongoing visibility into data health, which is way better than finding out about issues after they've already become violations.
Data profiling catches all the usual chaos - missing values, duplicates, wrong data types. Plus you'll find outliers and formatting nightmares (seriously, why does everyone format dates differently?). It also spots referential integrity problems and unexpected nulls where you need actual data. Pattern violations too, like wonky email addresses or phone numbers that make no sense. Think of it as your early warning system for messy data. I always run it on source data before big ETL jobs. Trust me, it beats debugging broken pipelines at 2am because someone's zip code field had emojis in it.
So profiling data helps you catch quality problems before they mess up your decisions. Look for patterns - seasonal stuff, missing chunks, weird outliers. That gives you the real story instead of just winging it. I learned this the hard way when we based our Q4 budget on completely unreliable sales data (ouch). Build some dashboards showing your key profiling metrics. Share those with your team so everyone's actually looking at the same picture. You'll spot which datasets are solid enough for the big calls and which ones... aren't.
So metadata is like your cheat sheet before you start profiling data warehouses. It shows you table structures, column types, relationships - all that stuff you need to know upfront. I always check this first because otherwise you're just guessing what you're looking at. It's like cooking without reading the recipe (learned that the hard way lol). You'll catch way more data quality issues if you actually understand what each dataset is supposed to contain. Trust me, validate your metadata first, then figure out which profiling checks make sense.
So instead of your analysts spending forever manually checking data quality, automated profiling does all that heavy lifting for you. It scans through massive datasets and flags stuff like missing values, duplicates, schema changes - you know, all the annoying things that break pipelines. Plus you get continuous monitoring instead of just checking once in a while, which honestly makes compliance way less stressful. Your team can actually fix problems instead of hunting for them all day. I'd start with your most critical data sources first - you'll see the impact pretty quickly that way.
Honestly, the biggest pain is just the sheer size of everything - these datasets will absolutely crush your system if you're not smart about it. Data quality is a nightmare too since different source systems never play nice together. Plus all those table relationships that nobody documented properly? Yeah, good luck figuring those out. Performance is brutal - profiling jobs take forever and everyone wants answers immediately. I'd say start with samples of your most important tables first. Gets you some quick wins while you figure out the rest. Trust me, trying to profile everything at once is a recipe for disaster.
So profiling basically scans your warehouse tables and spots where you've got the same data sitting in multiple places. Run some profiling tools to compare column patterns and value frequencies between tables - you'll be shocked at how much duplicate customer info is scattered everywhere! It flags identical records and tables storing the same business stuff under different names. Honestly, the visibility alone is worth it. Then you can figure out which redundant data to clean up first. Saves you storage costs and makes queries run faster too.
Most places do it monthly, but honestly it depends on how crazy your data gets. High-velocity stuff? Go weekly. Pretty stable warehouse? Maybe quarterly works. I've seen teams skip profiling for ages then freak out when everything slows to a crawl - don't be those guys. Between profiling runs, watch your query performance like a hawk. Set up alerts for when execution times go nuts beyond normal ranges. Then just tweak your schedule based on what you're seeing. It's really about finding that sweet spot for your specific setup.
Create a standard template that tracks your data quality stuff - completeness rates, nulls, duplicates, all that. Seriously, write down the weird patterns you spot because you'll forget them later and kick yourself. Timestamp everything since data shifts constantly. Your team needs easy access to this, so pick somewhere searchable. Oh, and make executive summaries that don't sound like tech gibberish - your non-tech stakeholders will actually read them. Start building that shared repo now so everyone uses the same format. Version your reports too, or you'll end up with a mess of conflicting docs.
Look, profiling shows you exactly what's been happening with your data over time - gaps, weird spikes, quality issues that snowballed. Start with your oldest stuff first, trust me on this one. That's where all the nasty surprises live. Once you see the patterns, you can actually make smart calls about storage and retention instead of just guessing. Plus it tells you which chunks people actually query so you're not optimizing random junk. I spent way too much time last month cleaning up data that could've been caught early with proper profiling. Sets you up for automated archiving rules too.
-
The slides are remarkable with creative designs and interesting information. I am pleased to see how functional and adaptive the design is. Would highly recommend this purchase!
-
Every time I ask for something out-of-the-box from them and they never fail in delivering that. No words for their excellence!