

Business Operational Risk Management Powerpoint Presentation Slides






Try Before you Buy Download Free Sample Product
 Impress Your
Audience
 100%
Editable
 Save Hours
of Time


Finding ways to reduce threats in business operations, then here You have professionally designed business operational risk management PowerPoint presentation graphics. Best thing is that with our content ready PPT you can easily manage your requirements and purposes of a risk assessment plan. To make this key risk indicator presentation more specific, we have added exclusive slides like industry operations summary, operational challenges, sales & marketing challenges, company strategy, product roadmap, financial summary, operating plan, threat mitigation strategies and many more. Not only this, our ORM presentation templates help to reduce the roadblocks in order to develop a better business management. Also, if you want to Create presentations on similar topics like risk assessment, implementation of threat control, strategic goals, tactical planning, integrated business planning, manpower planning, industry problem solving etc., then go with this organizational risk management PPT. So now what are you waiting for? Download our professionally created business operational risk management PowerPoint presentation graphics now and get the desired results. Address their gripes with our Business Operational Risk Management Powerpoint Presentation Slides. Identify cause for genuine complaint.
People who downloaded this PowerPoint presentation also viewed the following :
Content of this Powerpoint Presentation
Slide 1: This slide introduces Business Operational Risk Management. State Your Company Name and begins.
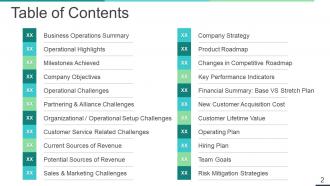
Slide 2: This slide shows Table of Contents with these highlights of the points we have listed- Business Operations Summary, Operational Highlights, Milestones Achieved, Company Objectives, Operational Challenges, Partnering & Alliance Challenges, Organizational / Operational Setup Challenges, Customer Service Related Challenges, Current Sources of Revenue, Potential Sources of Revenue, Sales & Marketing Challenges, Company Strategy, Product Roadmap, Changes in Competitive Roadmap, Key Performance Indicators, Financial Summary: Base VS Stretch Plan, New Customer Acquisition Cost, Customer Lifetime Value, Operating Plan, Hiring Plan, Team Goals, Risk Mitigation Strategies.
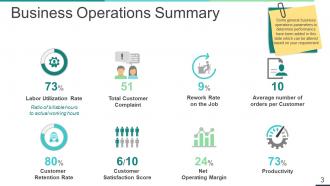
Slide 3: This slide presents Business Operations Summary. Some general business operations parameters to determine performance have been added in this slide which can be altered based on your requirement
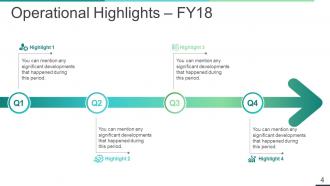
Slide 4: This slide showcases Operational Highlights.
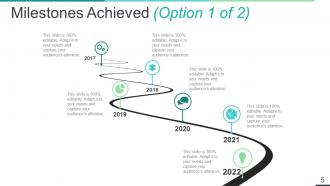
Slide 5: This slide presents Milestones Achieved (Option 1 of 2).
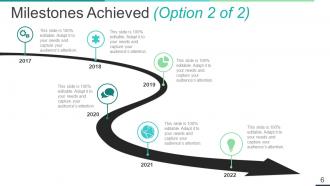
Slide 6: This slide shows Milestones Achieved (Option 2 of 2) with a circular timeline.
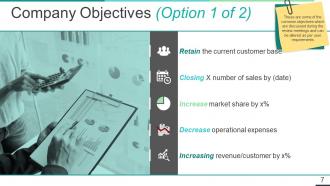
Slide 7: This slide presents Company Objectives (Option 1 of 2) with these of the points we have listed- Retain the current customer base, Increase market share by x%, Increasing revenue/customer by x%, Closing X number of sales by (date), Decrease operational expenses, These are some of the common objectives which are discussed during the review meetings and can be altered as per user requirements
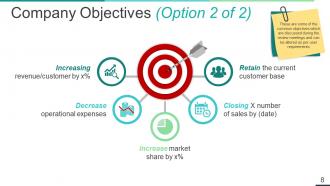
Slide 8: This slide showcases Company Objectives (Option 2 of 2) which further shows- Retain the current customer base, Increase market share by x%, Increasing revenue/customer by x%, Closing X number of sales by (date), Decrease operational expenses, These are some of the common objectives which are discussed during the review meetings and can be altered as per user requirements
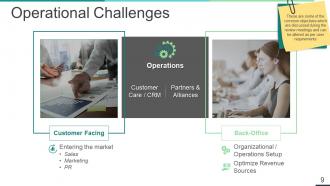
Slide 9: This slide presents Operational Challenges.These are some of the common objectives which are discussed during the review meetings and can be altered as per user requirements
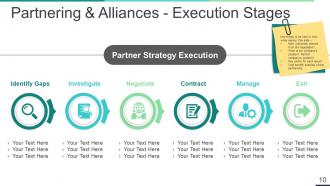
Slide 10: This slide showcases Partnering & Alliances - Execution Stages which further project- Partner Strategy Execution, Identify Gaps, Investigate, Negotiate, Contract, Manage, Exit
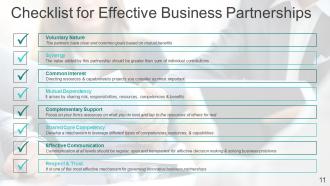
Slide 11: This slide showcases Checklist for Effective Business Partnerships with these of the eight points- Voluntary Nature, Synergy, Mutual Dependency, Respect & Trust, Effective Communication, Shared Core Competency, Complementary Support, Common Interest.
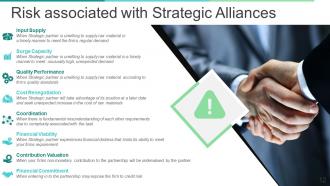
Slide 12: This slide showcases Risk associated with Strategic Alliances with these of the following strategies- Contribution Valuation, Financial Commitment, Financial Viability, Cost Renegotiation, Quality Performance, Surge Capacity, Coordination, Input Supply.
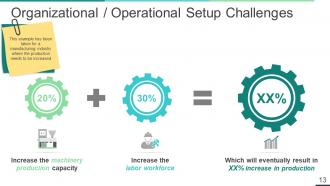
Slide 13: This slide presents Organizational / Operational Setup Challenges. This example has been taken for a manufacturing industry where the production needs to be increased
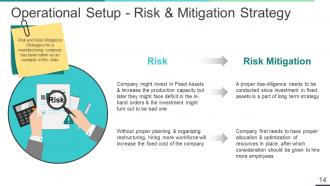
Slide 14: This slide showcases Operational Setup - Risk & Mitigation Strategy. Risk and Risk Mitigation Strategies for a manufacturing company has been taken as an example in this slide
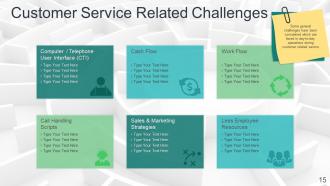
Slide 15: This slide shows Customer Service Related Challenges with these challenges we have projected- Cash Flow, Work Flow, Less Employee Resources, Call Handling Scripts, Computer / Telephone User Interface (CTI), Sales & Marketing Strategies, Some general challenges have been considered which are faced in day-to-day operations during customer related service
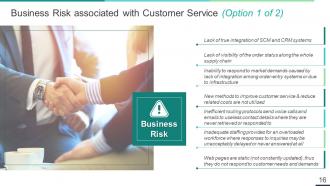
Slide 16: This slide presents Business Risk associated with Customer Service (Option 1 of 2) with the Business Risk.
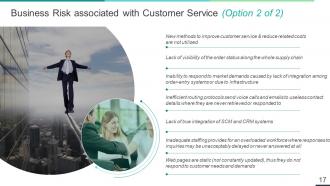
Slide 17: This slide showcases Business Risk associated with Customer Service (Option 2 of 2).
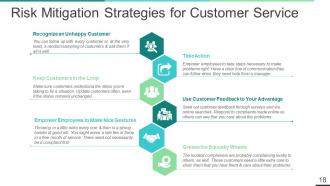
Slide 18: This slide shows Risk Mitigation Strategies for Customer Service some of the parameters- Recognize an Unhappy Customer, Take Action, Keep Customers in the Loop, Use Customer Feedback to Your Advantage.
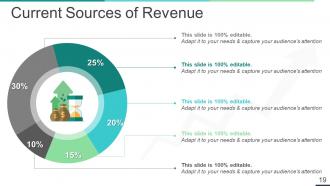
Slide 19: This slide presents Current Sources of Revenue.
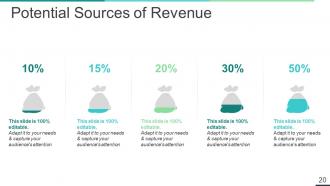
Slide 20: This slide showcases Potential Sources of Revenue.
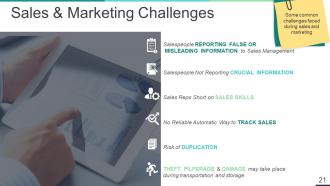
Slide 21: This slide presents Sales & Marketing Challenges. Some common challenges faced during sales and marketing
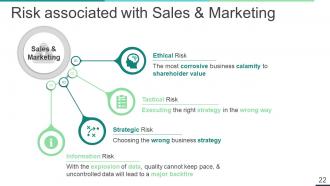
Slide 22: This slide shows Risk associated with Sales & Marketing with these of the factors- Sales & Marketing, Ethical Risk, Tactical Risk, Strategic Risk, Information Risk.
Slide 23: This slide presents Company Strategy.
Slide 24: This slide showcases Product Roadmap - Product Launch Deliverables.
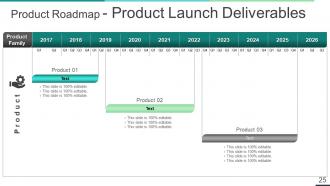
Slide 25: This slide shows Product Roadmap - Product Launch Deliverables.
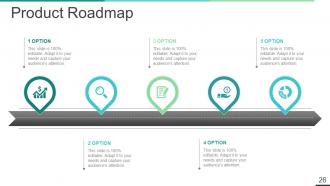
Slide 26: This slide presents Product Roadmap.
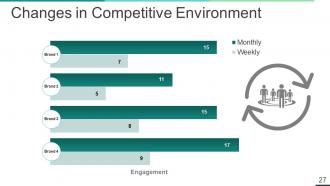
Slide 27: This slide presents Changes in Competitive Environment.
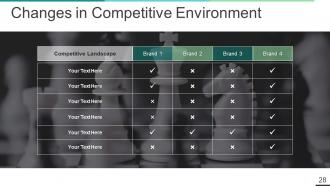
Slide 28: This slide shows Changes in Competitive Environment.
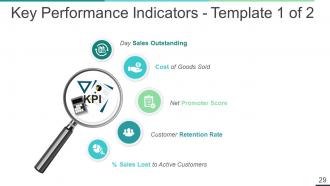
Slide 29: This slide presents Key Performance Indicators - Template 1 of 2 with these of the important factors- Net Promoter Score, Customer Retention Rate, % Sales Lost to Active Customers, Day Sales Outstanding, Cost of Goods Sold, KPI.
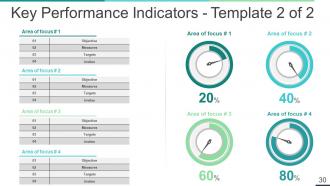
Slide 30: This slide presents Key Performance Indicators - Template 2 of 2.
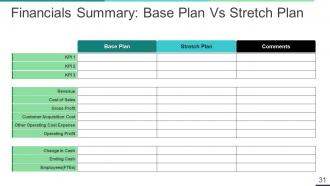
Slide 31: This slide showcases Financials Summary: Base Plan Vs Stretch Plan table.
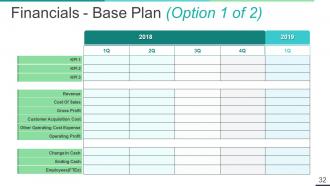
Slide 32: This slide shows Financials - Base Plan (Option 1 of 2).
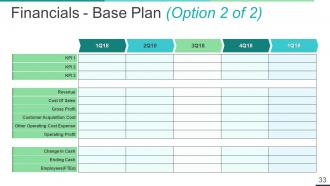
Slide 33: This slide presents Financials - Base Plan (Option 2 of 2).
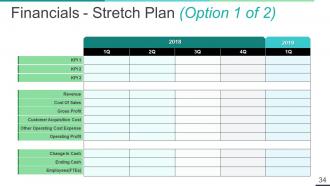
Slide 34: This slide shows Financials - Stretch Plan (Option 1 of 2) table.
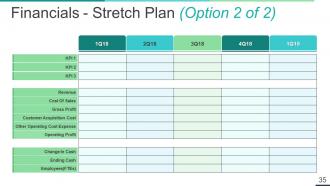
Slide 35: This slide presents Financials - Stretch Plan (Option 2 of 2) with these of the following characteristics- Revenue, Cost Of Sales, Gross Profit, Customer Acquisition Cost, Operating Profit, Change In Cash, Ending Cash, Employees(FTEs), Other Operating Cost Expense.
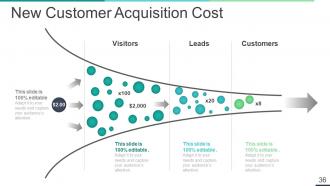
Slide 36: This slide presents New Customer Acquisition Cost with these of the three fatcors- Visitors, Leads, Customers.
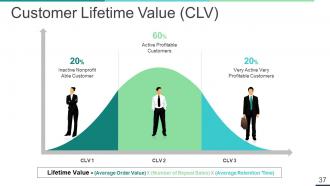
Slide 37: This slide showcases Customer Lifetime Value (CLV).
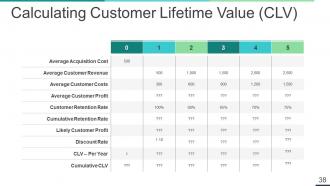
Slide 38: This slide presents Calculating Customer Lifetime Value (CLV) table.
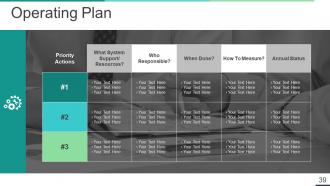
Slide 39: This slide shows Operating Plan table. You can add the data and use it.
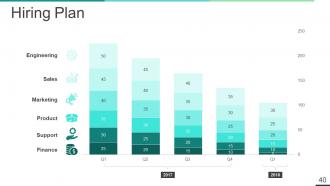
Slide 40: This slide showcases Hiring Plan with these of the few of the Engineering, Sales, Marketing, Product, Support, Finance.
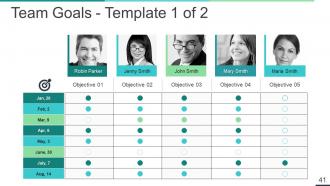
Slide 41: Thi slide presents Team Goals - Template 1 of 2.
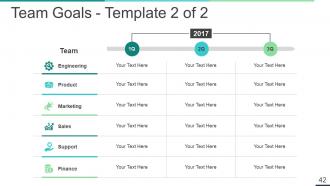
Slide 42: This slide presents Team Goals - Template 2 of 2 these parameters- Marketing, Engineering, Sales, Product, Support, Finance.
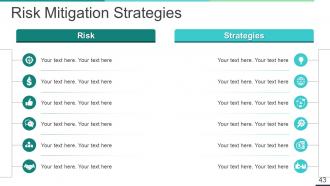
Slide 43: This slide showcases Risk Mitigation Strategies in which you can add the Risk, Strategies.
Slide 44: This slide presents Business Operational Risk Management Icons Set.
Slide 45: This slide is titled Additional Slides to move forward.
Slide 46: This slide represents Our Mission. State your mission, goals etc.
Slide 47: This is Our team slide with names and designation.
Slide 48: This is an About us slide to state company specifications etc.
Slide 49: This is an Our Goal slide. State your important goals here.
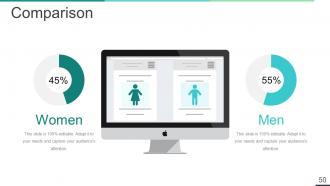
Slide 50: This slide shows Comparison of Positive Factors v/s Negative Factors with thumbs up and thumb down imagery
Slide 51: This is a Financial Score slide to show financial aspects here.
Slide 52: This is a Quotes slide to convey message, beliefs etc.
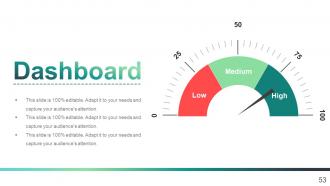
Slide 53: This is a Dashboard slide to show- Strategic System, Success, Goal Process, Sales Review, Communication Study.
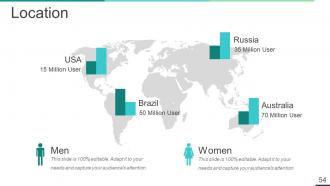
Slide 54: This is a Location slide to show global growth, presence etc. on world map.
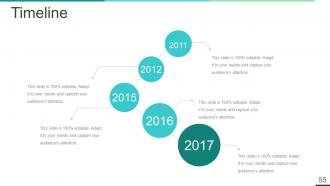
Slide 55: This is a Timelines slide to show- Plan, Budget, Schedule, Review.
Slide 56: This slide shows an image with text boxes titled Business Person with Post It notes.
Slide 57: This slide presents a Newspaper image with text boxes to flash company news, position etc.
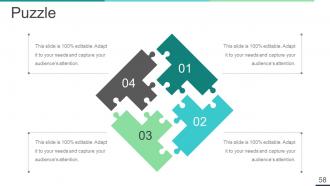
Slide 58: This is a Puzzle image slide to show information, specification etc.
Slide 59: This slide displays Our Target with a background image.
Slide 60: This is a Circular image slide to show information, specifications etc.
Slide 61: This is a Venn diagram image slide to show information, specifications etc.
Slide 62: This slide shows a Mind map for representing entities.
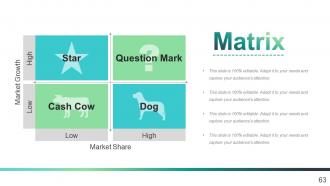
Slide 63: This slide shows a Matrix in terms of High and Low.
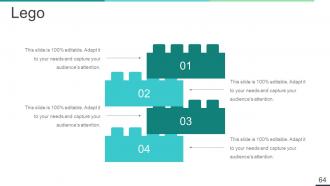
Slide 64: This is a LEGO slide with text boxes to show information
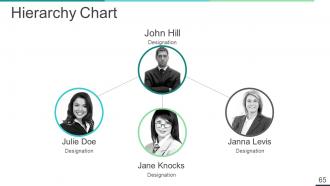
Slide 65: This is a Hierarchy slide showing- Supply Chain Manager, Supply Chain Council, Sourcing, Supplier Quality Engineer, Procurement, Logistics & Management, Supplier Management, Student, Contract Management
Slide 66: This is a Magnifying glass image slide to show information, scoping aspects etc.
Slide 67: This is a Silhouettes slide to show people specific information etc.
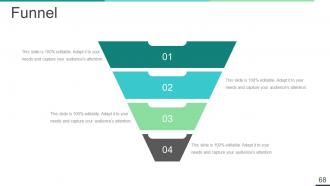
Slide 68: This slide showcases a Funnel with text boxes. State information, process in funnel form here.
Slide 69: This slide displays the title Charts & Graphs
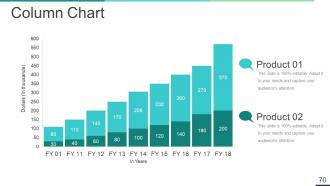
Slide 70: This is a Column Chart slide for product/entity comparison.
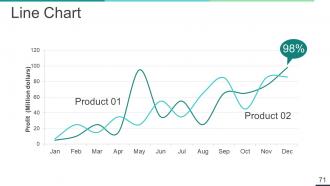
Slide 71: This is a Line Chart slide for product/entity comparison.
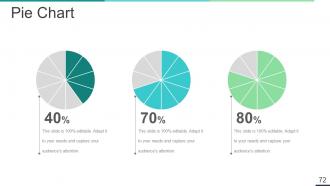
Slide 72: This slide showcases Pie Chart.
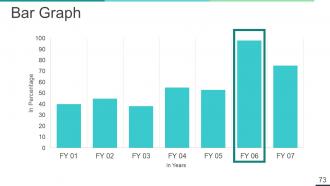
Slide 73: This is a Bar Graph image slide to show product comparison, growth etc.
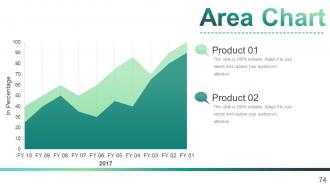
Slide 74: This is an Area Chart slide for product/entity comparison.
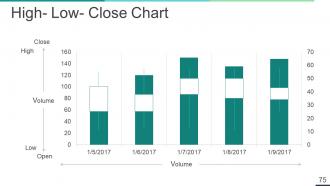
Slide 75: This slide showcases High- Low- Close Chart.
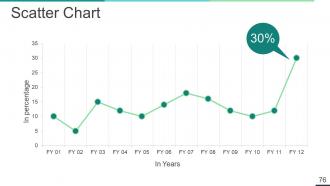
Slide 76: This slide shows Competitive Analysis with Scatter Chart/Radar Chart to compare.
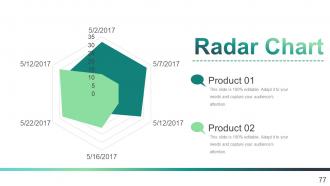
Slide 77: This is a Radar Chart slide for product/entity comparison.
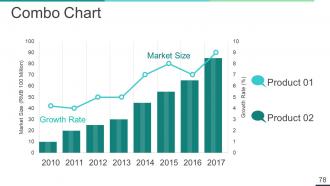
Slide 78: This slide showcases Combo Chart.
Slide 79: This is a Thank You slide with Address# street number, city, state, Contact Numbers, Email Address.
Slide 80: This is a Thank You slide.
Business Operational Risk Management Powerpoint Presentation Slides with all 80 slides:
Customize our Business Operational Risk Management Powerpoint Presentation Slides as you desire. They allow you to fashion every detail.











FAQs for Business Operational Risk Management
You'll need four main pieces: identifying risks, assessing them, monitoring, and having response plans ready. Start by mapping out what could go wrong - system crashes, process failures, people making mistakes. Figure out which ones are most likely and damaging. Set up alerts to catch problems early (this is where tons of companies mess up because it's boring but crucial). Have clear procedures for when stuff hits the fan. Oh, and don't forget to review everything regularly since risks change as you grow. I'd start with whatever's keeping you up at night first.
Start by looking at what's tanked other companies in your space - those horror stories usually highlight the big risks. Your frontline workers are honestly your best resource here since they spot problems way before management does. Check out what regulatory bodies publish for your industry too. Trade associations are super helpful - they've basically done the homework already with risk frameworks. Don't skip reviewing your insurance claims and close calls either. Oh, and do quarterly "risk walks" where you literally walk around asking "what could break here?" Sounds basic but you'd be surprised what you catch.
Dude, tech is like having superpowers for managing risk. Set up automated monitoring so problems get flagged before they become disasters. Analytics tools are crazy good at finding patterns in your data that you'd miss otherwise. Real-time dashboards show you everything that's happening instantly - way better than those nightmare spreadsheets everyone used to rely on (thank god that's over). You can also automate compliance reports and use AI to predict when stuff might break. My advice? Figure out where you're flying blind first, then find tools that'll fix those gaps.
Track revenue losses from disruptions and extra costs from failures - that's your starting point. Calculate risk-adjusted ROI by comparing actual profits to what you'd make without all the mess-ups. Honestly, some companies overcomplicate this with fancy Monte Carlo stuff when simple historical data works fine. Set up dashboards showing cost per incident type so you know which risks are actually draining money. Also watch how often incidents happen over time. The whole point is figuring out what's hitting your bottom line hardest so you can fix those first.
So there are basically four ways to handle operational risks. You can completely avoid them by changing how you do things or just stopping risky stuff altogether. Reducing them works too - better training, tighter controls, that kind of thing. Insurance is another route, though honestly it can get really expensive depending on what business you're in. Sometimes you just accept the risk if fixing it costs more than the actual problem would. I'd start with your biggest threats first - the ones that are both likely to happen and would really hurt if they did.
Honestly, culture can totally make or break your risk management when you're operating in different countries. Risk tolerance changes everywhere - something that's fine in one place might horrify people somewhere else. Communication styles are different too, and don't even get me started on how decision-making processes vary. Local regulations usually mirror what each culture values around compliance stuff. Your reporting and escalation procedures? They'll need adjustments for each spot. Even how employees report problems differs. I learned this the hard way once (expensive lesson). Build cultural awareness into your frameworks early - retrofitting later is a nightmare.
First things first - make reporting dead simple and actually safe. Nobody's gonna speak up if they're worried about getting thrown under the bus. Train people on what to report (honestly, I'd rather deal with too many reports than miss something big). Set up clear escalation rules based on how serious stuff is. Track everything in one place, but here's the key part - always circle back and tell people what happened after they reported something. Once people think their reports just vanish, they'll stop bothering. Oh, and definitely look at what's currently blocking people from reporting.
Think of it like disaster planning with spreadsheets - you're basically hunting for weak spots before they wreck you. Run "what if" scenarios: main supplier crashes, key people quit during a cyberattack, that sort of thing. Forces you to see those domino effects you'd totally miss otherwise. Honestly, most people stress about risks that sound terrifying but aren't actually likely. Focus on realistic scenarios that are nasty enough to break your current setup. I'd start with your three biggest operational nightmares and reverse-engineer from there. Way better than getting blindsided later.
So it totally depends on what industry you're in, but here's the main stuff. Financial services has Basel III - super formal operational risk frameworks, kind of a pain. Public companies deal with Sarbanes-Oxley and wow, the paperwork never ends. GDPR hits you if you touch any EU data at all. Then there's industry-specific things like HIPAA or PCI-DSS. My advice? Figure out which ones actually apply to you first - don't get overwhelmed by everything. Once you know what you're dealing with, just build the compliance checks into your regular risk reviews. Start by auditing what regulations you're already under.
Honestly, you can't treat operational risk like some side project anymore. Map those risks directly to your strategic goals and get them into your board reports. Use the same assessment methods across operational, financial, strategic - all of it. I've seen too many companies turn this into a pointless compliance thing (total waste). Your operational risk data should show up on executive dashboards right next to everything else. The whole point is integrating governance and reporting so operational stuff gets actual attention and resources, not just lip service.
Yeah, the main headache is that operational risk is super subjective - not like credit risk where you've got solid default numbers. You're trying to measure things like fraud, system crashes, or process screw-ups that don't really follow predictable patterns. Start with whatever data you can dig up: incident reports, near-misses, audit stuff. Build out some worst-case scenarios and fill the gaps with expert opinions. Honestly, don't stress about getting it perfect - a rough range is way better than nothing. Just create frameworks your team can actually work with and tweak as you go. The goal is consistency more than precision, at least initially.
Honestly? Training your people is the biggest thing you can do. Most screw-ups happen because someone didn't know the right process or ignored red flags they didn't recognize. Quarterly sessions work great - cover risk spotting, reporting procedures, your company's specific protocols. The real magic happens when people actually feel safe speaking up about problems. You want early warnings, not nasty surprises later. Once your team has that muscle memory built up, they'll catch issues way before they blow up into major headaches. Way cheaper than dealing with disasters after the fact.
Honestly, your bosses set the whole vibe here. If leadership doesn't give a damn about operational risks, why would anyone else? You need them actually bringing this stuff up in meetings and putting real money behind it - not just lip service. The "tone at the top" thing sounds cheesy but it's legit true. When your CEO talks openly about potential problems and makes it clear people won't get thrown under the bus for speaking up, that changes everything. Maybe start by getting leadership to share risk examples from their own departments at the next company meeting? People follow what they see modeled.
Track your incident rates and how bad they are when they hit. Time-to-fix is crucial too. Monitor your control scores and audit results - compliance breaches will bite you later. System downtime is probably the most painful metric tbh, especially during busy periods. Financial stuff matters: actual loss amounts and what it costs to recover. Oh, and don't just look backward. You need metrics that warn you before things blow up, not just count the damage after. Mix of leading indicators with your usual lagging ones gives you the real picture.
So basically you want to catch problems before they explode in your face, right? Continuous monitoring gives you real-time alerts instead of finding out about disasters when customers are already pissed off. Think of it like having your business health on a dashboard rather than just doing those yearly checkups (which honestly feel so 2010). Monthly deep-dives into the data help you spot patterns early. Set up automated alerts for your biggest risk triggers - trust me, you'll thank yourself later. The whole point is shifting from "oh shit, something broke" to actually seeing trouble coming.
-
Illustrative design with editable content. Exceptional value for money. Highly pleased with the product.
-
Best Representation of topics, really appreciable.