

Business process reengineering and change management powerpoint presentation slides





Try Before you Buy Download Free Sample Product
 Impress Your
 Audience
 100%
100% Editable
 Save Hours
 of Time


Change is the only constant. This quote stands true and is vastly beneficial if implemented well. That's why it is always a better idea to refresh your business models in order to reach the most sustaining system. SlideTeam presents you a creatively designed bundle of PPT's for recommencing your business ideas. Business Process Re-engineering and Change management PowerPoint presentation slides are surely the way to your quantum leap. Subheadings like planning, sustaining pathways to success, assessment & preparation for change and implementation are included to simplify change management PPT. Appealing icons and stepwise models are included for the presentation of diverse topics. It’s one of the most convenient way of modeling and constructing your process of information flow. Bar graphs, pie charts, a family tree are few to mention schemes used in these change management PowerPoint slides along with images corresponding to change management are incorporated in the PPT's. Initiate and get over with half the work right now. Counter great challenges with our Business Process Reengineering And Change Management Powerpoint Presentation Slides. Display boundless grit and determination.
People who downloaded this PowerPoint presentation also viewed the following :
Content of this Powerpoint Presentation
Slide 1: This slide introduces Business Process Reengineering & Change Management. State Your Company Name and begin.
Slide 2: This is an Agenda slide. State your agendas here.
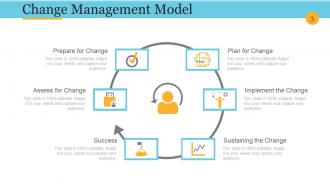
Slide 3: This slide presents a Change Management Model with the following subheadings- Assess For Change, Prepare For Change, Plan For Change, Sustaining The Change, Success, Implement The Change.
Slide 4: This slide showcases areas of Continuous Improvement- People, Tools, Process, Change, Evaluate, Design, Implement, Manage Change, Assets.
Slide 5: This slide showcases the Forces For Change- Mergers & Acquisitions, Electronic Commerce, Digital Convergence, Virtual Organization, Privatizations, Knowledge Economy.
Slide 6: This slide presents Barriers To Change in change management.
Slide 7: This slide presents Rate of Success in Change Efforts being- Not Very Successful, Moderately Successful, Too Soon to Tell, Unsure, Very Successful as parameters.
Slide 8: This slide shows Principles Of Change with the following sub points- Resistance And Comfort, Incremental Vs. Radical Change, The Right Answer Is Not Enough, Value Systems, Change Is a Process, Authority For Change, Sender And Receivers.
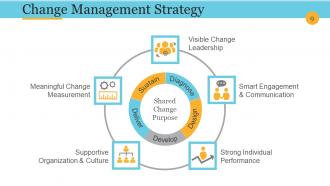
Slide 9: This slide showcases Change Management Strategy with the following sub points- Visible Change Leadership, Smart Engagement & Communication, Supportive Organization & Culture, Strong Individual Performance, Meaningful Change Measurement, Shared Change Purpose.
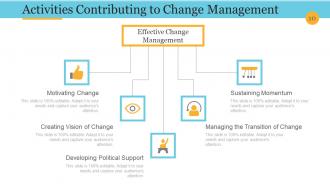
Slide 10: This slide shows Activities Contributing To Change Management with the following sub headings- Motivate, Oversight, Provide Vision, Engage, Involve, Short - Term Goals, Secure Gains, Sustain.
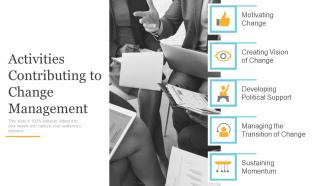
Slide 11: This is another slide on Activities Contributing To Change Management with the following sub headings- Motivating Change, Creating Vision Of Change, Developing Political Support, Managing The Transition Of Change, Sustaining Momentum.
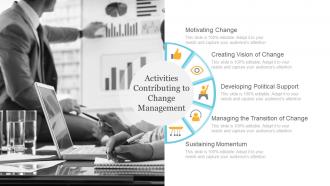
Slide 12: This is another slide on Activities Contributing To Change Management with the following sub headings- Motivating Change, Creating Vision Of Change, Developing Political Support, Managing The Transition Of Change, Sustaining Momentum.
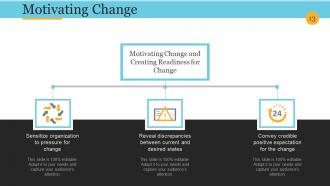
Slide 13: This slide presents Motivating Change displaying- Motivating Change and Creating Readiness for Change: Sensitize organization to pressure for change Convey credible positive expectation for the change Reveal discrepancies between current and desired states
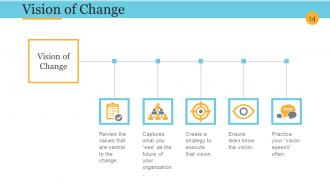
Slide 14: This slide presents Vision Of Change with- Review The Values That Are Central To The Change. Captures What You “See” As The Future Of Your Organization. Create A Strategy To Execute That Vision. Ensure Team Know The Vision. Practice Your “Vision Speech” Often.
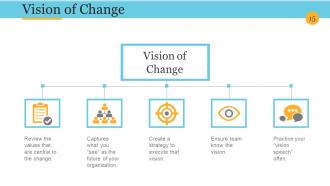
Slide 15: This is another variation slide on Vision of Change. Review The Values That Are Central To The Change. Captures What You “See” As The Future Of Your Organization. Create A Strategy To Execute That Vision. Ensure Team Know The Vision. Practice Your “Vision Speech” Often.
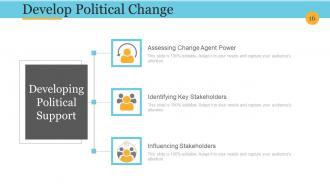
Slide 16: This slide shows Develop Political Change with the following sub headings- Assessing Change Agent Power, Identifying Key Stakeholders, Influencing Stakeholders.
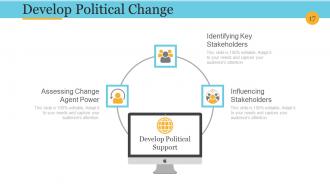
Slide 17: This slide shows Develop Political Change with the following sub headings- Assessing Change Agent Power, Identifying Key Stakeholders, Influencing Stakeholders.
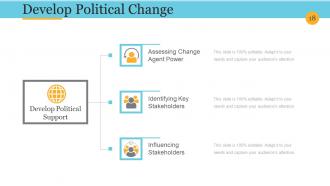
Slide 18: This slide shows Develop Political Change with the following sub headings- Assessing Change Agent Power, Identifying Key Stakeholders, Influencing Stakeholders.
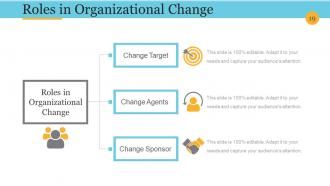
Slide 19: This slide presents Roles In Organizational Change with the following sub headings- Change Agents, Change Target, Change Sponsor.
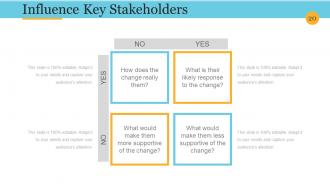
Slide 20: This slide presents a matrix on Influence Key Stakeholders. The key parameters are- What Is Their Likely Response To The Change? What Would Make Them Less Supportive Of The Change? How Does The Change Really Them? What Would Make Them More Supportive Of The Change?
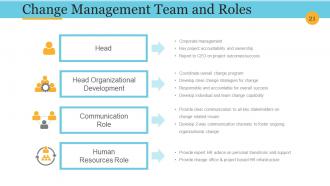
Slide 21: This slide presents Change Management Team And Roles divided into- Head, Head Organizational Development, Communication Role, Human Resources Role.
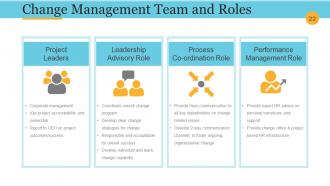
Slide 22: This slide presents Change Management Team And Roles as- Project Leaders, Leadership Advisory Role, Process Co-ordination Role, Performance Management Role.
Slide 23: This is a Coffee break image slide to halt. You can change the slide content as per need.
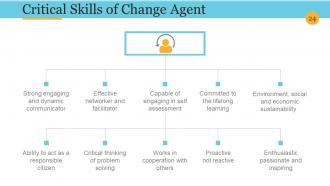
Slide 24: This slide shows Critical Skills Of Change Agent- Enthusiastic Passionate And Inspiring, Comitts To The Lifelong Learning Of Themselves And Others, Understanding Of Environment, Social And Economic Connection, Ability To Act As A Responsible Citizen, Capable Of Engaging In Self Assessment, Self Reflection And Analysis, Critical And Systems Thinker With The Ability To Solve Problems Creatively, Effective Networker And Facilitator, Works In Corporation With Others, Strong Engaging And Dynamic Communicator, Proactive Not Reactive.
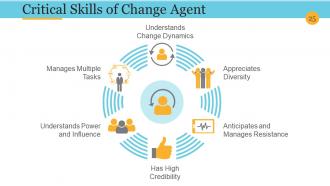
Slide 25: This is another slide on Critical Skills Of Change Agent with the following points- Understands Power And Influence, Manages Multiple Tasks, Understands Change Dynamics, Has High Credibility, Anticipates And Managers Resistance, Appreciates, Diversity.
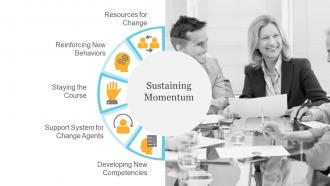
Slide 26: This slide showcases Sustaining Momentum with the following sub headings- Staying the Course, Reinforcing New Behaviors, Support System for Change Agents, Resources for Change, Developing New Competencies.
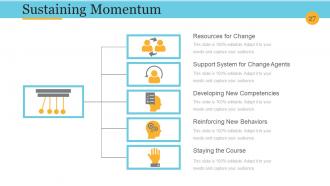
Slide 27: This slide showcases Sustaining Momentum with the following sub headings- Staying the Course, Reinforcing New Behaviors, Support System for Change Agents, Resources for Change, Developing New Competencies.
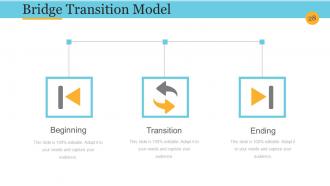
Slide 28: This slide shows Bridge Transition Model with- Beginning, Transition, Ending.
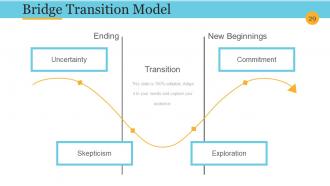
Slide 29: This slide shows a Bridge Transition Model graph with- Ending , Transition, New Beginnings, Uncertainty, Skepticism, Exploration, Commitment.
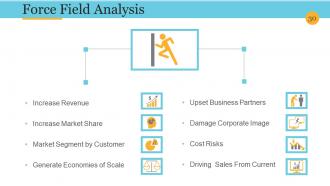
Slide 30: This slide shows Force Field Analysis with the following points- Obtain Customers In Another Market Segment, Generate Economies, Of Scale For Production, Increase Revenue, Increase Market Share, Damage Corporate Image, Driving Sales From Current, Upset Business Partners, Cost Risks.
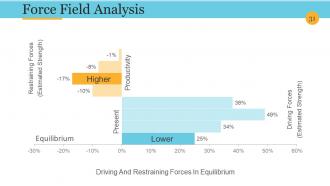
Slide 31: This slide presents a Force Field Analysis graph with the following parameter- Present Productivity, Restraining Forces (Estimated Strength), Equilibrium, Driving Forces (Estimated Strength).
Slide 32: This slide presents a Change Curve with Satisfaction, Denial, Resistance, Commitment, Hope, Exploration, Commitment, Resistance. Looking to the past and Looking to the future.
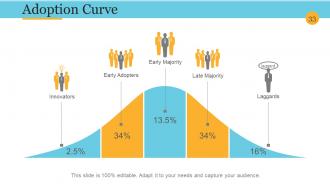
Slide 33: This slide shows Adoption Curve with - Laggards, Late Majority, Early Majority, Early Adopters, Innovators.
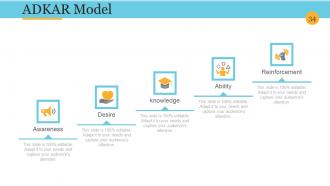
Slide 34: This slide shows an ADKAR model with- Desire, Knowledge, Ability, Awareness, Reinforcement.
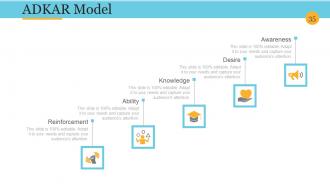
Slide 35: This is another variation slide of ADKAR model showing- Desire, Knowledge, Ability, Awareness, Reinforcement.
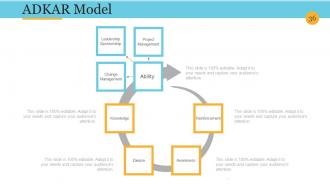
Slide 36: This slide shows ADKAR model with Leadership /Sponsorship, Change Management, Project Management. Project Management, Ability, Reinforcement, Awareness, Desire, Knowledge.
Slide 37: This is Business Change Control Process Icons Set. Use the icons as per requirement.
Slide 38: This slide is titled Additional Slides to move forward. You can alter the slide content as per need.
Slide 39: This is Our Vision slide with Mission and Goals. State these aspects here.
Slide 40: This is Our Team slide to state team specifications, information, etc.
Slide 41: This is an About Us slide. State company specifications here.
Slide 42: This is Our Goal slide. State them here.
Slide 43: This slide showcases Comparison of two entities in a creative scale form.
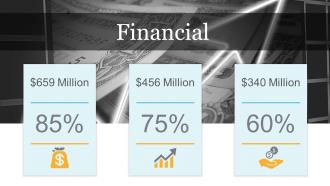
Slide 44: This slide is titled Financial. Show finance related stuff, stats etc. here.
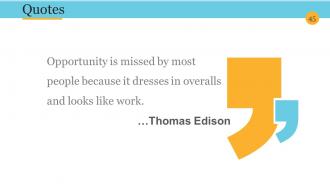
Slide 45: This is a Quotes slide. You may add/modify the slide content as per need.
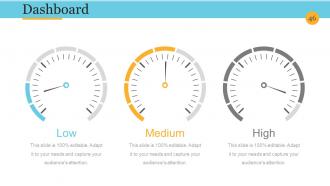
Slide 46: This is a Dashboard slide to state metrics, kpis etc.
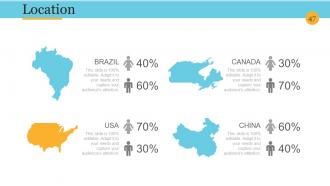
Slide 47: This is Location image slide of world map image to show global growth, presence etc.
Slide 48: This is a Timeline slide to show growth factors, milestones, highlights, etc.
Slide 49: This is a Timeline slide to show growth factors, milestones, highlights, etc.
Slide 50: This is a Timeline slide to show growth factors, milestones, highlights, etc.
Slide 51: This slide showcases Important Notes to be displayed. Show events, important piece of information, events etc. here.
Slide 52: This is a Puzzle image slide to show information, specifications etc.
Slide 53: This is a Target image slide to show targets, goals, information, aspirations etc.
Slide 54: This is a Circular image slide to show targets, goals, information, aspirations etc.
Slide 55: This slide showcases Newspaper image. Show events, important piece of information, events etc. here.
Slide 56: This is a Venn Diagram image slide to show information, specifications etc.
Slide 57: This is a Mind map image slide to show information, segregation, specifications etc.
Slide 58: This is a Matrix slide to show information, specifications etc.
Slide 59: This is a Lego Blocks Diagram slide to show information, specifications etc.
Slide 60: This is a Hierarchy Diagram slide to show organization information, team specifications etc.
Slide 61: This is a Bulb or Idea slide to state a new idea or highlight specifications/information etc.
Slide 62: This slide shows a Magnifying glass image with text boxes. State information etc. here.
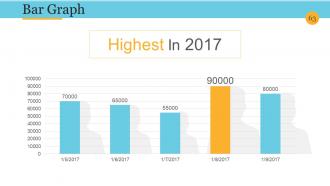
Slide 63: This slide presents a Bar Graph for showcasing product/company growth, comparison etc.
Slide 64: This slide displays a Funnel image. State information, funneling aspects etc. here.
Slide 65: This slide is titled Our Charts to move forward. You can alter the slide content as per need.
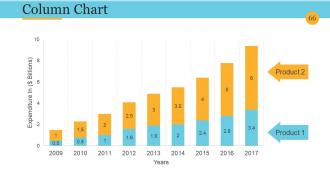
Slide 66: This is a Column Chart slide for product/entity comparison, specifications.
Slide 67: This slide presents a Line Chart for product specifications, comparison etc. to show.
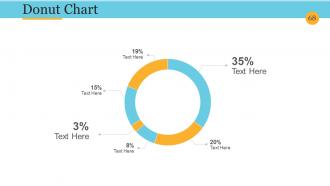
Slide 68: This slide presents a Donut Chart for product specifications, comparison etc. to show.
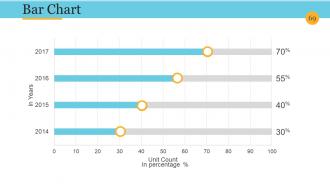
Slide 69: This slide presents a Bar Chart for showcasing product/company growth, comparison etc.
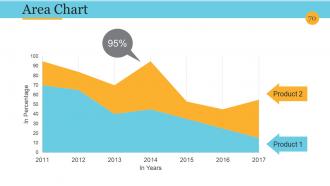
Slide 70: This is an Area Chart slide. State specifications, comparison of products/entities here.
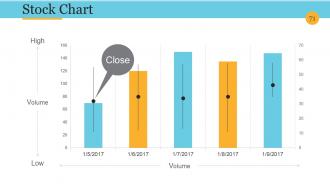
Slide 71: This is a Stock Chart slide. State specifications, comparison of products/entities here.
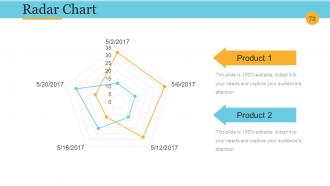
Slide 72: This is a Radar Chart slide. State specifications, comparison of products/entities here.
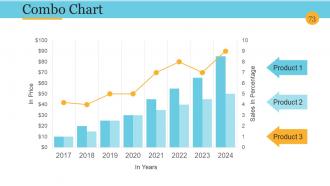
Slide 73: This slide presents a Combo Chart for showcasing product/company growth, comparison etc.
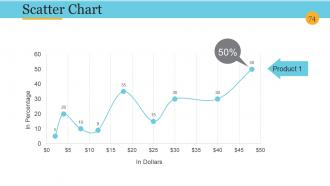
Slide 74: This is a Scatter Chart slide to show product comparison, growth etc.
Slide 75: This is a Staked Line Chart slide. State specifications, comparison of products/entities here.
Slide 76: This is a Contact Us slide with Address # street number, city, state, Contact Numbers, Email Address to be put and displayed.
Slide 77: This is a THANK YOU slide for acknowledgement and ending a presentation etc.
Business process reengineering and change management powerpoint presentation slides with all 77 slides:
PowerPoint is a great tool when you need to create a compelling presentation but many do abuse its use. Just leave the creation of your Business Process Reengineering And Change Management Powerpoint Presentation Slides to the professionals who are trained for that.
-
Business Process Reengineering Change Management
-
Agenda
-
Change Management Model
-
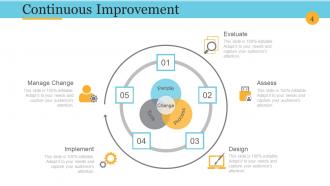
Continuous Improvement
-
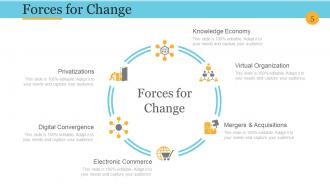
Forces for Change
-

Barriers to Change
-
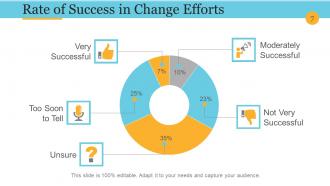
Rate of Success in Change Efforts
-
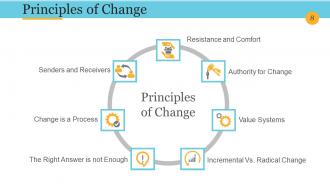
Principles of Change
-
Change Management Strategy
-
Activities Contributing to Change Management
-
Activities Contributing to Change Management
-
Activities Contributing to Change Management
-
Motivating Change
-
Vision of Change
-
Vision of Change
-
Develop Political Change
-
Develop Political Change
-
Develop Political Change
-
Roles in Organizational Change
-
Influence Key Stakeholders
-
Change Management Team and Roles
-
Change Management Team and Roles
-
Coffee Break
-
Critical Skills of Change Agent
-
Critical Skills of Change Agent
-
Sustaining Momentum
-
Sustaining Momentum
-
Bridge Transition Model
-
Bridge Transition Model
-
Force Field Analysis
-
Force Field Analysis
-

Change Curve
-
Adoption Curve
-
ADKAR Model
-
ADKAR Model
-
ADKAR Model
-
Business Change Control Process Icons Set
-

Additional Slides
-

Our Vision
-
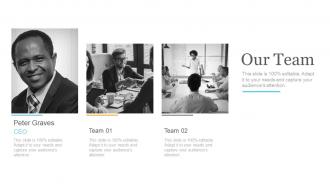
Our Team
-
About Us
-
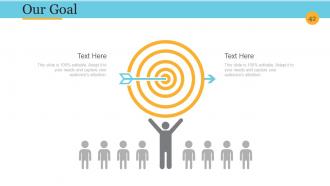
Our Goal
-
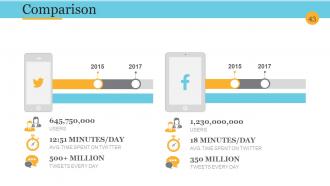
Comparison
-
Financial
-
Quotes
-
Dashboard
-
Location
-
Timeline
-
Timeline
-
Timeline
-
Important Notes
-
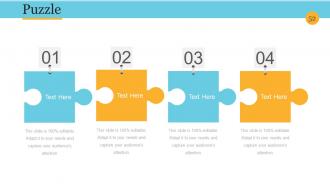
Puzzle
-
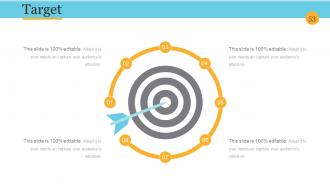
Target
-

Circular
-

The Daily Newspaper
-
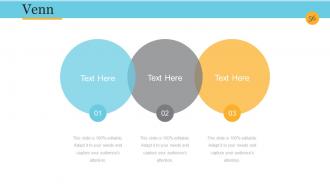
Venn
-
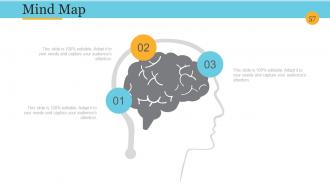
Mind Map
-
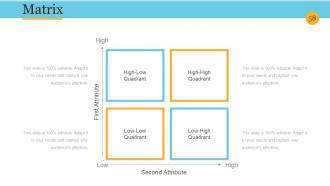
Matrix
-
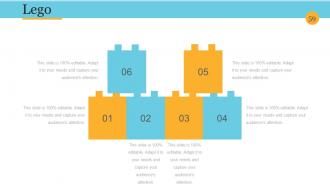
Lego
-
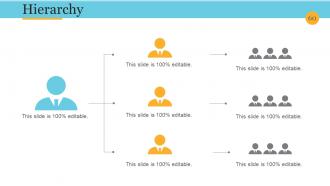
Hierarchy
-
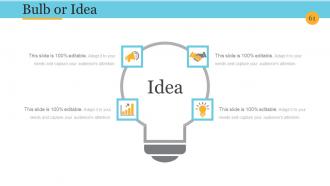
Bulb or Idea
-
Magnifying Glass
-
Bar Graph
-

Funnel
-

Our Charts
-
Column Chart
-

Line Chart
-
Donut Chart
-
Bar Chart
-
Area Chart
-
Stock Chart
-
Radar Chart
-
Combo Chart
-
Scatter Chart
-

Staked Line
-
Contact us
-

Thank You
FAQs for Business process reengineering and change management
So BPR is basically about blowing up your current processes and rebuilding them completely. You're going after big wins - cutting costs, speeding things up, boosting quality. It's not the small tweaks you'd normally do. Instead, you start from zero and ask "how would we actually design this if we were doing it today?" Honestly, most companies are terrified of this approach because it means admitting their current way sucks. But that's the whole point - you eliminate all the redundant crap and bottlenecks. Technology becomes huge here for automating the manual stuff. Just be ready to question literally everything about how work flows through your organization.
Honestly, just follow the complaints - your team already knows which processes suck. Map out your current workflows first, then spot where things consistently break down or need tons of manual work. Look for the biggest bottlenecks slowing everything down. Check your metrics too - what's missing targets or costing way more than it should? I'd prioritize based on impact vs how hard it'll actually be to fix. Oh, and customer complaints are gold for this stuff. Your employees will literally tell you which tasks make them miserable if you ask.
So basically, tech is what actually makes your BPR ideas work in real life. Map out your dream process first - this is where most people mess up and let the software dictate everything. Once you know what you want, then pick tools that fit. Could be ERP systems, automation stuff, or just better dashboards so people aren't flying blind. The whole point is automating the boring manual work and getting departments to actually talk to each other. I've seen too many teams buy fancy software first then try to force their processes around it. Don't be those guys.
Honestly? Get your people involved from the start - don't just dump decisions on them later. Put employees on the actual design teams since they know the broken processes way better than management does. Communication matters a ton too, so keep updating everyone on what's happening and why you're changing things. I've watched so many of these projects crash because executives thought they could just mandate everything from above. Oh, and celebrate small wins as you go - builds momentum. Find your process champions first and let them own parts of it.
So you gotta measure both the obvious stuff and the sneaky good metrics. Cycle time, cost savings, error rates - those are no-brainers. Customer satisfaction scores too. But honestly? Revenue per employee is where it's at - most people sleep on that one. Also track how fast you're handling customer requests now vs before, plus employee productivity and compliance rates. Oh and definitely get your baseline numbers first or you'll have nothing to compare against. Pick maybe 3-4 that actually matter for your situation and watch them for at least six months after you roll everything out.
So BPR is like tearing down your house and rebuilding from scratch. Continuous improvement? More like renovating room by room. With Lean or Six Sigma, you're gradually tweaking what's already there - cutting waste, making small efficiency gains over time. BPR throws everything out the window and asks "how should we actually do this?" from zero. Honestly, most companies probably jump to BPR too quickly when they just need better optimization. If your processes work but need polish, stick with continuous improvement. Only go full BPR if things are fundamentally broken.
Oh man, people HATE change - that's your biggest enemy right there. Leadership needs to actually care too, not just give lip service to it. Scope creep will kill you, and honestly? Most teams have no clue how messy redesigning workflows gets. You're literally telling everyone their job is wrong, so yeah, expect pushback. Timeline estimates always suck because nobody thinks about the ripple effects. My advice? Pour money into change management early or watch it crash and burn. Communication has to be constant, like annoyingly constant.
Honestly, figure out your big-picture goals first before you mess with any processes. I've watched companies dive straight into redesigning stuff without knowing why they're doing it - such a headache. Get people on your team who actually get where the company's headed, not just the process nerds. Check in regularly to see if your new processes are hitting the right metrics. Oh, and keep leadership involved the whole time, not just that initial kickoff meeting everyone forgets about. They need to confirm each change actually gets you closer to what you're trying to accomplish.
Dude, culture is everything when it comes to BPR. I've seen companies totally bomb because nobody wanted to change how they did things. If people are stuck in old ways or there's tons of red tape, you're screwed before you start. Employees dig in their heels, managers get territorial - the whole thing falls apart. But when teams actually want to try new stuff and care more about customers than office drama? That's when process redesigns actually work. My advice? Figure out what kind of culture you're dealing with first. Don't waste time redesigning workflows if people aren't ready for change anyway.
Honestly, the numbers don't lie - data analytics shows you exactly where your processes are breaking down. Look at your cycle times, error rates, and how you're using resources first. Those patterns will jump out at you once you dig in. I always tell people to model different scenarios before making changes (saves you from expensive mistakes). Historical data is gold for spotting where delays happen most. You can literally see which steps actually add value vs. the ones that just... exist. Oh, and don't skip tracking metrics after you implement stuff - otherwise you're flying blind on whether it worked.
Don't try automating broken stuff first - fix the process, then automate it. Get leadership on board early or you're screwed. Your team's gonna resist change way more than you think, trust me on this. Actually talk to the people doing the daily work! They know what's really broken better than anyone in a meeting room. Proper training takes forever, don't rush it. Most BPR projects I've seen tank because people think it's just swapping out software instead of changing how the whole organization works. Set clear goals upfront and keep everyone in the loop constantly.
Honestly, customer insights are everything for BPR - they tell you what's actually broken instead of what you *think* is broken. Map out their pain points first because our internal assumptions? Usually dead wrong. I learned this the hard way on a project last year. Use surveys, interviews, journey mapping - whatever gets you real feedback. These insights help you pick which processes to tackle and make sure your redesign actually fixes customer problems, not just internal stuff. Don't touch any processes until you've collected that feedback first.
Honestly, any company drowning in outdated, messy processes should consider BPR. Manufacturing and healthcare are obvious ones. Financial services too - banks love their bureaucracy, right? Insurance claims are probably the worst offender I can think of. Retail and logistics see massive improvements because there's so many moving parts. Look for red flags like endless manual handoffs, approval chains that go nowhere, or legacy systems from the stone age. If customers keep complaining about wait times and your processes haven't changed in forever, that's basically screaming for a complete overhaul.
Don't wait until the end to think about change management - that's a disaster waiting to happen. Get your key people involved from day one in redesigning stuff. People hate changes they had no say in creating. Communication matters way more than you'd think. Keep explaining WHY you're doing this, not just what's changing. The tech side? Usually straightforward. Getting humans to actually adopt new processes though... that's where things get messy. Training helps, obviously. But find some change champions in each team - they're worth their weight in gold for handling daily pushback and questions.
Oh man, Ford's accounts payable case is legendary - they slashed their staff by 75% just by redesigning how they matched purchase orders and invoices electronically. IBM Credit did something similar with loan approvals, replacing this crazy multi-step process with one person handling everything. These examples are old (like 90s old) but still totally relevant. You'll want to hunt for those annoying handoff points between departments - that's where the magic happens. Those bottlenecks are perfect for tearing apart and rebuilding from scratch.
-
Professional and unique presentations.
-
Unique research projects to present in meeting.