


Business Swot Analysis Product Comparison And Competitive Landscape Powerpoint Presentation Slides






Try Before you Buy Download Free Sample Product
 Impress Your
 Audience
 100%
100% Editable
 Save Hours
 of Time


If you are looking for a new way of presenting organizational strategies, our content ready pre-designed business swot analysis product comparison and competitive landscape PowerPoint presentation slides are perfect for you. This strategic management PowerPoint template includes slides on company overview, elevator pitch, our team, problems and solutions, value proposition product / service, product roadmap, milestones achieved, traction, business model, revenue streams, expense model, growth strategy, go-to-market strategy, competitive landscape, product comparison, SWOT analysis, financial projections, break-even analysis, financing, shareholding pattern, exit strategy etc. Our professionally designed business strategy PPT graphics are widely used for topics such as SWOT analysis with portfolio analysis, competitive marketing analysis, competitive positioning, positional analysis, competitive advantage, competitive analysis tools, competitor SWOT analysis, strategic planning techniques, situation analysis, market analysis, strategic fit, corporate planning etc. Competitive intelligence PowerPoint slide can be used to present how to identify barriers and limit goals. Download our strategic market plan PowerPoint template to enhance the credibility of interpretation. Our Business Swot Analysis Product Comparison And Competitive Landscape Powerpoint Presentation Slides ensure a fair game. They adhere to accepted ethics.
People who downloaded this PowerPoint presentation also viewed the following :
Content of this Powerpoint Presentation
Slide 1: This slide introduces Business SWOT Analysis, Product Comparison and Competitive Landscape. State Your company name and get started.
Slide 2: This slide shows Table of Contents with the following points- Company Overview / Elevator Pitch, Business Model, SWOT Analysis, Our Team, Revenue Streams, Product Comparison, The Problem, Revenue Model, Financial Projection, The Solution, Expense Model, Break-Even Analysis, Value Proposition - Product Service, Growth Strategy, Financing, Product Roadmap, Go-to-Market Strategy, Use of Funds, Milestones Achieved, Marketing Strategy, Shareholding Pattern, Traction, Competitive Landscape, Exit Strategy.
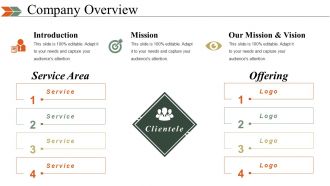
Slide 3: This slide showcases Company Overview showing- Clientele, Service, Service Area, Logo, Offering, Introduction, Our Mission & Vision.
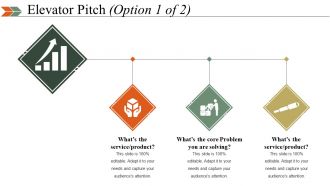
Slide 4: This slide shows Elevator Pitch presenting- What’s the service/product? What’s the core Problem you are solving? What’s the service/product?
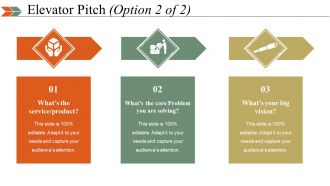
Slide 5: This slide shows Elevator Pitch presenting- What’s the service/product? What’s the core Problem you are solving? What’s your big vision?
Slide 6: This is Our Team with Primary Responsibilities slide to state team specifications, roles, information, structure etc
Slide 7: This slide presents The Problem with a creative imagery. To better illustrate your problem, as well as convey the problem statement to someone who’s less immersed in it than you, consider adding some components in the following way: 1. Customer Tries Something; 2. Here’s the terrible they are facing; 3. Existing solutions are broken/Non-existent
Slide 8: This slide presents The Problem with a creative lock imagery. If the investor has no clue what the product does even after getting deep into a pitch; now is the time for a short explanation or demo.
Slide 9: This slide presents The Problem with a creative puzzle imagery. State problem aspects here.
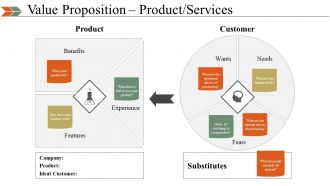
Slide 10: This slide shows Value Proposition – Product/Services in terms of- Product and Customer.
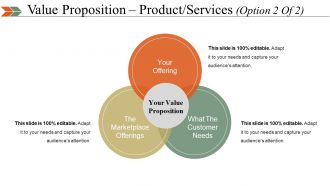
Slide 11: This slide shows Value Proposition – Product/Services in terms of- Your Offering, What The Customer Needs, The Marketplace Offerings.
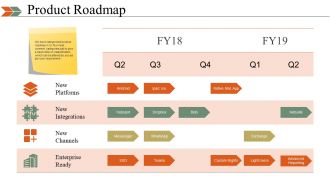
Slide 12: This slide presents a Product Roadmap showing- New Platforms, New Integrations, New Channels, Enterprise Ready. We have categorized product roadmap in to four most common categories just to give a basic idea on classification which can be altered by you as per your requirement.
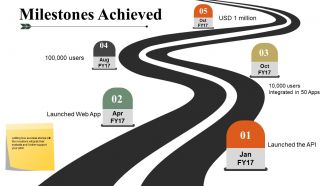
Slide 13: This slide showcases Milestones Achieved. Adding few success stories with the investors will grab their eyeballs and further support your pitch.
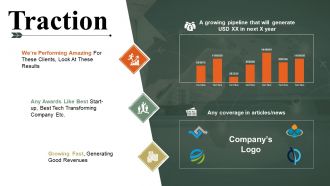
Slide 14: This slide shows Traction consisting of- A growing pipeline that will generate USD XX in next X year, Any coverage in articles/news, We’re Performing Amazing For These Clients, Look At These Results, Any Awards Like Best Start-up, Best Tech Transforming Company Etc. Growing Fast, Generating Good Revenues.
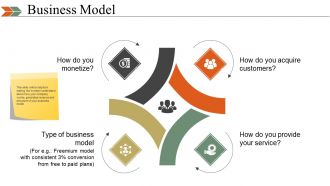
Slide 15: This slide presents the Business Model showcasing- How do you acquire customers? How do you monetize? How do you provide your service? Type of business model This slide will be helpful in making the investor understand about how your company works, generates revenue and structure of your business model.
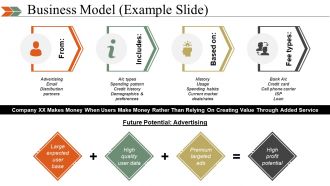
Slide 16: This slide also presents the Business Model showcasing- From: Advertising, Email, Distribution partners. Includes: A/c types, Spending pattern, Credit history, Demographics & preferences. Based on: History, Usage, Spending habits, Current market deals/rates. Fee types: Bank A/c, Credit card, Cell phone carrier, ISP, Loan, Company XX Makes Money When Users Make Money Rather Than Relying On Creating Value Through Added Service, Large expected user base, High quality user data, Premium targeted ads, High profit potential. Future Potential: Advertising.
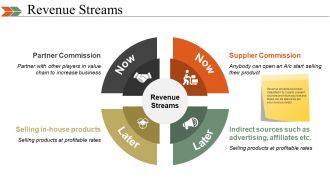
Slide 17: This slide displays Revenue Streams namely- Supplier Commission Indirect sources such as advertising, affiliates etc. Selling products at profitable rates Partner Commission Revenue streams have been classified in to 2 parts: present sources and future sources and these can be altered as per your revenue model.
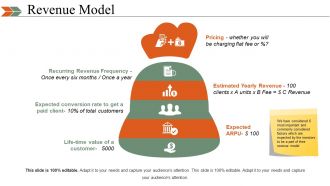
Slide 18: This slide showcases the Revenue Model showing- Life-time value of a customer, Pricing, Recurring Revenue Frequency, Estimated Yearly Revenue, Expected conversion rate to get a paid client, Expected ARPU, We have considered 6 most important and commonly considered factors which are expected by the investors to be a part of their revenue model.
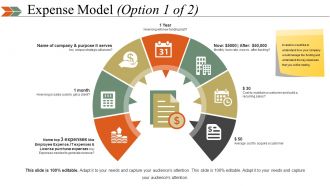
Slide 19: This slide presents an Expense Model showing- Name top 3 expenses like Employee Expense, IT expenses & License purchase expenses Key Expenses needed to generate revenue Name of company & purpose it serves Any unique strategic alliances? Average cost to acquire a customer. Cost to maintain a customer and build a recurring sales? Monthly burn rate, now vs. after funding? How long will new funding last? Investors would like to understand how your company would manage the funding and understand the key expenses that you will be making
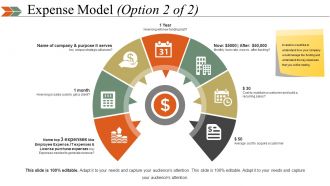
Slide 20: This slide also presents an Expense Model showing- Name top 3 expenses like Employee Expense, IT expenses & License purchase expenses Key Expenses needed to generate revenue Name of company & purpose it serves Any unique strategic alliances? Average cost to acquire a customer. Cost to maintain a customer and build a recurring sales? Monthly burn rate, now vs. after funding? How long will new funding last? Investors would like to understand how your company would manage the funding and understand the key expenses that you will be making.
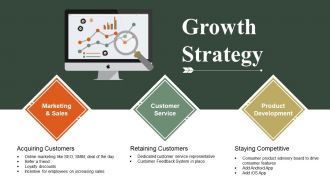
Slide 21: This slide showcases Growth Strategy shiwing- Acquiring Customers, Retaining Customers, Staying Competitive as Marketing & Sales, Customer Service, Product Development.
Slide 22: This slide presents Go-to-Market Strategy showing- Provocation, Discovery, Discovery, Design, Recommenda-tion, Outcomes, Goal Alignment/Validation. This slide varies but the goal is the same: Show you’re thinking about (or have data or an unfair advantage in) distribution.
Slide 23: This slide showcases Marketing Strategy through- Paid Advertising, Social Media, Blog, Email Marketing, Website Design, Analytics & Reporting, Search Engine Optimization.
Slide 24: This slide presents Competitive Landscape divided into- Direct Competitors and Indirect Competitors.
Slide 25: This is a Product Comparison table slide.
Slide 26: This slide showcases SWOT Analysis.
Slide 27: This slide also showcases SWOT Analysis.
Slide 28: This slide too presents SWOT Analysis.
Slide 29: This slide displays Financial Projections in tabular form.
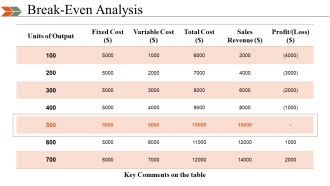
Slide 30: This slide prsents a Break-Even Analysis in tabular form.
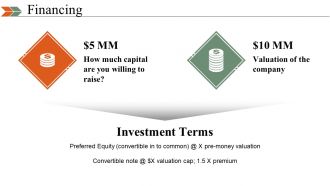
Slide 31: This slide shows Financing with- Investment Terms, How much capital are you willing to raise? Valuation of the company.
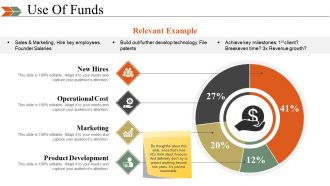
Slide 32: This slide shows Use Of Funds with the following subheadings- New Hires, Operational Cost, Marketing, Product Development.
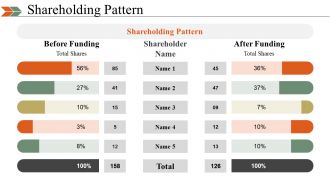
Slide 33: This slide showcases the Shareholding Pattern with- After Funding and Before Funding with total Shares.
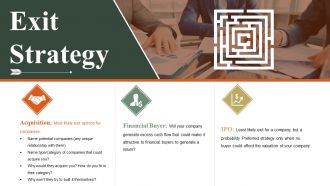
Slide 34: This slide showcases Exit Strategy showing- Acquisition, Financial Buyer, IPO.
Slide 35: This is a Client Testimonials slide with name to put with image boxes.
Slide 36: This is a Contact Details slide.
Slide 37: This is a Coffee break image slide to halt. You can change the slide content as per need.
Slide 38: This slide is titled Charts and Graphs to move forward. You can alter the slide content as per need.
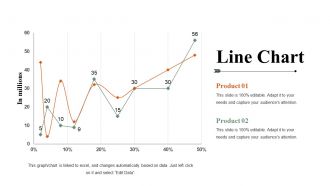
Slide 39: This is a Line chart slide. State specifications, comparison of products/entities here.
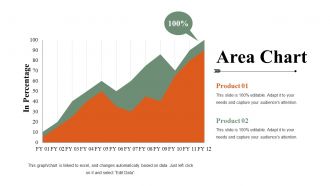
Slide 40: This is an Area chart slide. State specifications, comparison of products/entities here.
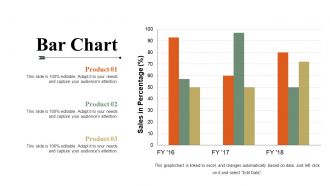
Slide 41: This is a Bar chart slide. State specifications, comparison of products/entities here.
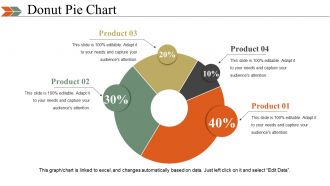
Slide 42: This is a Donut Pie chart slide. State specifications, comparison of products/entities here.
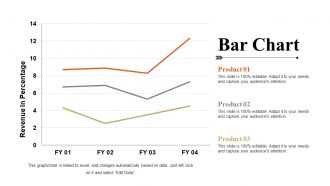
Slide 43: This is another Area chart slide. State specifications, comparison of products/entities here.
Slide 44: This slide is titled Additional Slides to move forward. You can change the slide content as per need.
Slide 45: This is Our Mission Goal slide. State your mission here.
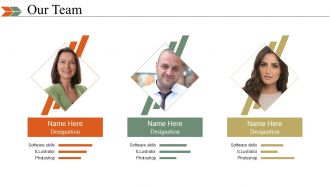
Slide 46: This is Meet Our Team slide with names, designation and text boxes.
Slide 47: This is an About Us slide. State company/team specifications here.
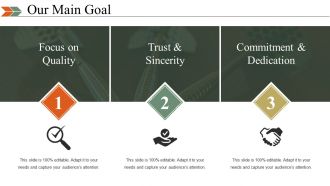
Slide 48: This is Our Main Goal slide. State your goals here.
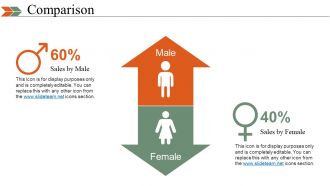
Slide 49: This slide showcases Comparison of two entities in arrow imagery form.
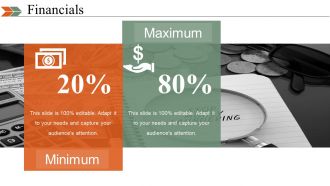
Slide 50: This is a Financial score slide. State financial aspects, information etc. here.
Slide 51: This is a Quotes slide to convey company/organization message, beliefs etc. You may change the slide content as per need.
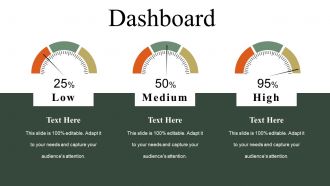
Slide 52: This slide presents Dashboard to present Kpis, metrics etc.
Slide 53: This is a Puzzle image slide. State information, specifications etc. here.
Slide 54: This is a Target image slide. State targets, information, specifications etc. here.
Slide 55: This is a Mind map image slide to show information, specifications etc.
Slide 56: This is a Timeline slide to show company growth, milestones evolution etc.
Slide 57: This is a Location slide of world map image to show global presence, growth etc.
Slide 58: This is a Bulb or Idea image slide to show innovative information, specifications etc.
Slide 59: This is a Magnifying Glass image slide to show information, specifications etc.
Slide 60: This is a Thank You slide with Address# street number, city, state, Contact Number, Email Address.
Business Swot Analysis Product Comparison And Competitive Landscape Powerpoint Presentation Slides with all 60 slides:
Use our Business Swot Analysis Product Comparison And Competitive Landscape to effectively help you save your valuable time. They are readymade to fit into any presentation structure.
-

Business SWOT Analysis Product Comparison and Competitive Landscape
-
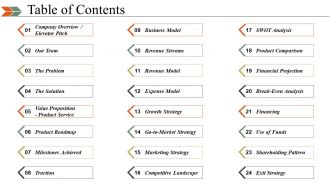
Table of Contents
-
Company Overview
-
Elevator Pitch Option 1 of 2
-
Elevator Pitch Option 2 of 2
-
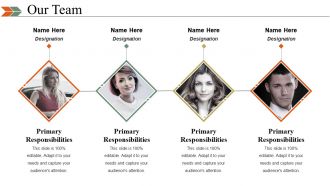
Our Team
-
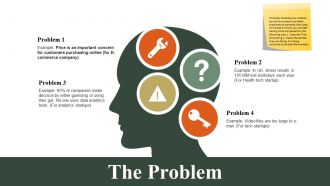
The Problem
-
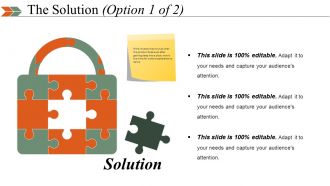
The Solution Option 1 of 2
-
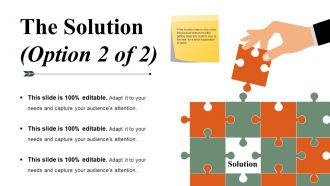
The Solution Option 2 of 2
-
Value Proposition Product Services
-
Value Proposition Product Services Option 2 Of 2
-
Product Roadmap
-
Milestones Achieved
-
Traction
-
Business Model
-
Business Model Example Slide
-
Revenue Streams
-
Revenue Model
-
Expense Model Option 1 of 2
-
Expense Model Option 2 of 2
-
Growth Strategy
-
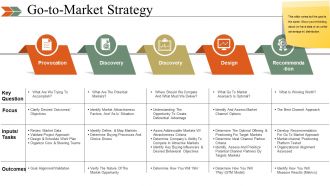
Go to Market Strategy
-
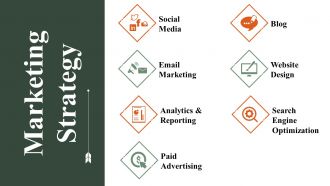
Marketing Strategy
-
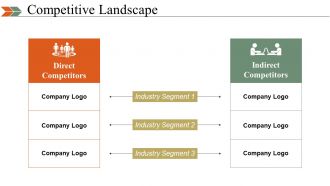
Competitive Landscape
-
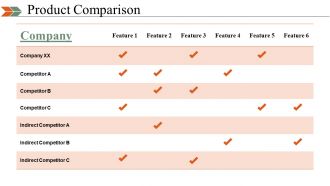
Product Comparison
-
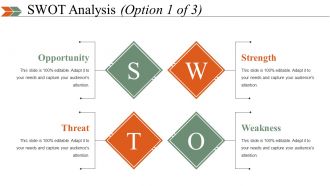
SWOT Analysis Option 1 of 3
-
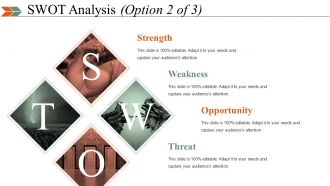
SWOT Analysis Option 2 of 3
-
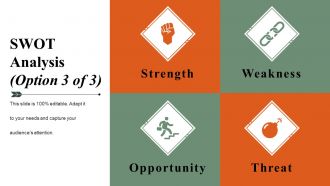
SWOT Analysis Option 3 of 3
-
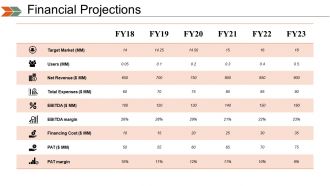
Financial Projections
-
Break Even Analysis
-
Financing
-
Use Of Funds
-
Shareholding Pattern
-
Exit Strategy
-

Client Testimonials
-
Contact Details
-

Business SWOT Analysis Product Comparison and Competitive Landsc
-

Charts Graph
-
Line Chart
-
Area Chart
-
Bar Chart
-
Donut Pie Chart
-
Bar Chart
-

Additional Slides
-

Our Mission
-
Our Team
-

About Us
-
Our Main Goal
-
Comparison
-
Financials
-

Quotes
-
Dashboard
-
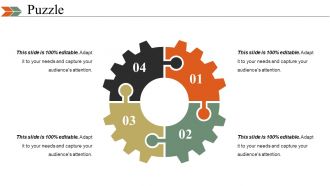
Puzzle
-
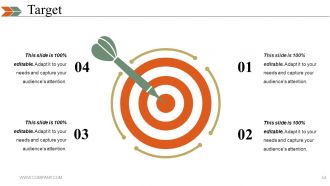
Target
-
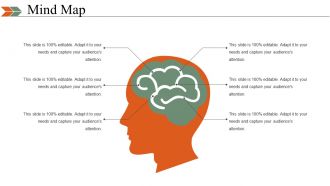
Mind Map
-
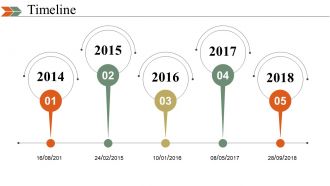
Timeline
-

Location
-
Business SWOT Analysis Product Comparison and Competitive Landsc
-
Magnifying Glass
-

Thank You Card Design
FAQs for Business Swot Analysis Product Comparison And Competitive Landscape
Ok so SWOT works when you don't BS yourself in each section. Strengths and weaknesses are stuff you actually control - your team, resources, whatever. Opportunities and threats? That's the outside world, competitors, market changes. Here's the thing though - people always go way too easy on the weaknesses part, which is honestly pointless. You want the real insights? Cross-match everything. Like, can your strengths help you grab those opportunities? Do your weak spots leave you exposed to threats? Be specific, not vague, and actually use it to make decisions.
Honestly, think of it like matching puzzle pieces - you want to map what you're already crushing onto new opportunities out there. Start by listing your top 3 strengths, then brainstorm which market shifts they could unlock. Say your team's amazing at data analysis. You could probably jump on the AI wave way faster than competitors who'd have to build that skill from zero. That's a real advantage right there. Don't chase every shiny new thing though - timing matters. Focus on opportunities where your existing strengths actually give you an edge. I mean, why start from scratch when you've got a head start?
Honestly, start by getting real about what's actually screwing you over. Pick your worst 2-3 weaknesses and treat each one like a puzzle to crack. Missing tech skills? Invest in training or bring in experts - boom, now you've got capabilities others don't. It's kinda wild how weaknesses can become your secret weapon if you flip the script. Don't just sit there accepting them as facts of life. I'd brainstorm specific fixes for each weakness, then figure out which ones you can actually turn into advantages. Some might surprise you with the opportunities they reveal.
So basically, you want to look at two things: how likely is this crap to actually happen, and how badly would it mess you up if it did? Make a list of everything that could go wrong, then rate each threat on both those scales. The scary stuff that's both likely AND would wreck your business? Yeah, those need action plans yesterday. Medium-level threats just need some monitoring and backup plans sitting in your back pocket. Low-risk ones you can check on every few months or whatever. Honestly, a simple grid makes this way easier to visualize - and don't forget to put someone in charge of watching each category.
Think of SWOT as having a brutally honest conversation with yourself about your business. You're mapping out strengths you can use that competitors can't match, plus spotting weaknesses that might bite you later. The threats part is actually my favorite - it makes you think like your competition and predict their next moves. Super helpful for positioning decisions. Being real about where you suck compared to rivals is tough but necessary. Then you either fix those gaps or find clever ways to work around them entirely. It's basically organized strategic thinking instead of just winging it.
Don't just do SWOT once and forget about it. Honestly, I've watched so many teams create these fancy charts that never see daylight again - total waste. Run it quarterly with your leadership crew and actually use the results in your strategy sessions. Turn those insights into real action items. Got strengths? Use them to go after opportunities. Weaknesses showing up? Fix them before they bite you later. Assign someone to own each piece and track what's happening. Oh, and start your next meeting by reviewing the last SWOT - keeps everyone from just talking in circles.
Honestly, the worst thing you can do is be super vague about everything. Skip the fluff like "good customer service" - that tells you nothing. Get specific and measurable instead. Also, don't just sit alone brainstorming this stuff. Talk to people from other departments or you'll totally miss obvious things. I've seen way too many SWOTs that list like 15 weaknesses... it's overwhelming and nobody acts on any of it. Stick to 3-5 key items per section. Once you're done, actually schedule time to revisit it in a few months. Otherwise it'll just sit in some folder forever.
Dude, you should totally try using tech for your next SWOT analysis. Survey tools like Microsoft Forms let you collect feedback from tons of people at once instead of chasing everyone down individually. Analytics platforms are great too - they'll catch patterns you'd probably miss doing it by hand. Plus remote teams can jump in real-time, which is clutch these days. Miro's pretty solid for creating those visual dashboards that actually look professional when you present to the bosses. Honestly, I still love a good whiteboard session sometimes, but digital just makes everything smoother. Way better than drowning in sticky notes!
Honestly, doing SWOT analysis with your team makes such a huge difference. Different people spot things you'd totally miss on your own - like marketing sees opportunities that finance wouldn't even think about, or ops knows about weaknesses that leadership has no clue about. Way more brains = way better threat identification too. The group discussion part is clutch because you actually figure out what matters most instead of just dumping every random idea on paper. I always think solo analysis feels kind of... incomplete? Try it as a workshop next time. You'll get way deeper insights than going it alone.
Honestly? Every 6 months is the sweet spot I've found. Maybe annually if you're being lazy about it, but don't wait longer than that. Major stuff happens fast - new competitors pop up, markets shift, leadership drama, whatever. That analysis from last year is probably garbage now. Do quick quarterly check-ins too, just to see if anything big changed. Oh, and actually put it in your calendar or you'll totally forget. I learned that the hard way when I realized our whole strategy was based on info that was like two years old.
Oh man, culture completely changes how you read SWOT analysis. Like, being super direct might be a strength in American business, but in Japan? Could totally backfire. Your team's background shapes what they even see as strengths or weaknesses in the first place. I've watched this screw up analyses more times than I can count - some cultures won't even openly talk about weaknesses because it feels wrong. You really need different perspectives on your team. Before you wrap anything up, just have an honest conversation about how everyone's cultural lens might be affecting what you're seeing. Makes such a difference.
SWOT works great for nonprofits, you just gotta think mission instead of money. Strengths could be your volunteer army or community connections. Funding issues and thin staff are obvious weaknesses - honestly, that's where most nonprofits I know really struggle. Look for new grant opportunities or partnerships with similar orgs. Oh, and policy changes that help your cause count too. Threats? Budget cuts, competition from other nonprofits, new regulations that mess with your work. The biggest shift is tracking social impact rather than revenue, which can be tricky but way more meaningful.
Track metrics that connect to each part of your SWOT analysis. Revenue growth and market share for your strengths. Cost cuts or process fixes for weaknesses. Customer acquisition and new market stuff for opportunities - that's usually the fun part to measure. Threats are honestly the hardest to track, but you can look at risk indicators or how you're doing against competitors. Don't go crazy with data though. Pick maybe 2-3 metrics per strategy max. Then do quarterly check-ins to see if your SWOT actually moved the needle on real business results.
SWOT's pretty solid for spotting risks honestly. The weaknesses part shows you what's broken internally, and threats are the external stuff that could mess you up. But here's what I actually like about it - you can flip your strengths into shields against those risks. Sometimes opportunities even let you turn problems into something good (though that doesn't always work out, let's be real). I'd map each weakness and threat to actual actions you'll take, then figure out what's most likely to bite you first. Way better than just winging it.
Look, tons of big companies actually use SWOT for real decisions - not just PowerPoint fluff. Apple did it before the iPhone launch, figuring out they were great at design but sucked at telecom stuff. Netflix used it when ditching DVDs for streaming (smart move, obviously). Even Starbucks ran one during their messy 2008 period when they'd opened way too many stores. The thing is, these analyses actually guided billion-dollar pivots. You should write yours down and check back every few months - your competition and market will shift faster than you think.
-
Enough space for editing and adding your own content.
-
Easily Understandable slides.
-
Very unique, user-friendly presentation interface.
-
Informative presentations that are easily editable.