


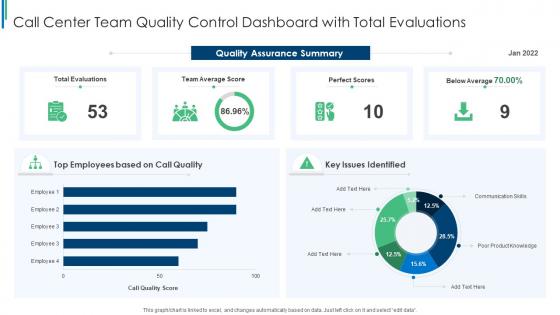
Call Center Team Quality Control Dashboard Snapshot With Total Evaluations




Try Before you Buy Download Free Sample Product
 Impress Your
 Audience
 100%
100% Editable
 Save Hours
 of Time


This graph or chart is linked to excel, and changes automatically based on data. Just left click on it and select edit data.
People who downloaded this PowerPoint presentation also viewed the following :
Call Center Team Quality Control Dashboard Snapshot With Total Evaluations with all 7 slides:
Use our Call Center Team Quality Control Dashboard Snapshot With Total Evaluations to effectively help you save your valuable time. They are readymade to fit into any presentation structure.






FAQs for Call Center Team Quality Control Dashboard Snapshot
Focus on the big ones first - FCR, average handle time, customer satisfaction scores, and your QA ratings from call reviews. Abandon rate matters too since nobody likes waiting forever. I'd definitely track agent schedule adherence or things get messy real quick. Net Promoter Score is awesome if you can actually get people to fill out surveys (good luck with that lol). Don't go crazy adding every metric you can think of though. Start with these basics, see what's actually broken, then add more based on your specific headaches.
Dude, get a quality control dashboard set up - it shows you in real time how your agents are doing so you can fix stuff before it gets messy. All your important metrics live in one spot: call times, customer satisfaction, complaint patterns, whatever. Honestly, it's crazy how much you miss without one. You'll quickly see who needs extra training and which processes are totally broken. Then you can coach people better and actually improve things. Oh, and don't go overboard at first - pick like 3-4 key metrics to track or you'll just confuse yourself with too much data.
Real-time monitoring is like having a fire alarm for your call center - way better than finding out about disasters after the fact. You can actually jump in when calls go off the rails and coach people in the moment. The dashboard shows you everyone at once, which honestly saves so much time. I've watched too many teams miss chances to fix things because they waited for weekly reports or whatever. Set up alerts for your important stuff so you're not glued to the screen constantly. Trust me, catching patterns early beats playing cleanup later.
Connect your speech analytics to the dashboard using their REST APIs - Verint and CallMiner both make this pretty easy. Don't dump every metric on there though, that's just overwhelming. Focus on sentiment trends, keyword alerts, and compliance red flags. Those are what actually matter day-to-day. Set up automated triggers so sketchy calls get flagged right away. Honestly, the visualization piece is where most people mess up - run it by a pilot group first to see what actually helps them spot problems faster. Way better than guessing what works.
Dude, focus on the stuff your team actually checks daily - agent scores, resolution rates, customer satisfaction. Make it visual with charts and color coding so problems jump out immediately. I swear, half the dashboards I've used look like Excel threw up on them. Your filters need to be super intuitive, and people should be able to zoom from big picture down to individual agent stuff easily. Oh, and definitely test it with real users first - they'll find weird issues you never thought of. Trust me on that one.
So basically, these dashboards show you everything in real-time - call times, customer satisfaction, whether agents are sticking to scripts. Pretty useful stuff. You'll spot who's struggling with what skills super quick, then coach them on exactly those areas. The coolest part? You can see patterns across your whole team. Like if everyone's bombing calls about the same product issue - that's on your training, not them. I'd definitely set up alerts for the big metrics first so you're not glued to your screen all day. Way better than just winging it with generic training programs.
Honestly, a good dashboard is a lifesaver for compliance stuff. It tracks all the boring metrics regulators want - call recording rates, consent docs, data handling, whatever. Real-time alerts catch your agents before they mess up, which is clutch. Creates that audit trail too, and trust me, inspectors eat that up. Instead of digging through different systems for days, you can pull compliance reports in minutes. Weekly scorecards for team leads work great - makes everyone's job way easier. Oh, and it basically keeps you out of hot water with violations.
Honestly, real-time metrics are everything for call centers. Line charts work great for tracking call volume and how long it takes to solve issues. Bar charts are super useful too - perfect for comparing how different agents are doing or breaking down call types. Heat maps? Those are clutch for spotting when things get crazy busy or seeing which agents crush it at what. Oh, and gauge charts for customer satisfaction scores give you that quick visual punch. Keep it simple though - supervisors need to glance at these during the chaos and make snap decisions. Fancy stuff just slows everyone down.
Honestly, you'll want daily updates at minimum for call center QC stuff. Real-time is way better though - catches problems while they're actually happening instead of after the damage is done. I've worked with teams that only checked weekly reports and it was a disaster. Quality issues just snowballed. Hourly refreshes work great if real-time feels like overkill for your setup. Oh, and definitely automate those data pulls - manually updating dashboards gets old fast. Your agents will probably notice the difference when you're staying on top of things better.
Honestly, the data stuff will make you want to pull your hair out. Getting clean info from phones, CRM, chat platforms - it's like they were designed to never work together. Agents hate being watched (I mean, who wouldn't?), so sell it as coaching help instead of Big Brother nonsense. Don't go crazy with metrics either. Too many and people tune out completely. I'd stick with maybe 3-4 solid ones at first. Once everyone's cool with those, then you can add more. The whole "boil the ocean" approach never works anyway.
So you'll want to pull emotion scores from call transcripts and chat logs in real-time. Heat maps are honestly a game changer for spotting patterns fast. Track sentiment trends over time and see how each agent performs. Set up alerts when sentiment tanks so managers can jump in right away. Oh, and definitely correlate negative spikes with specific issues or time periods - that's where the good insights are. Distribution charts showing your positive/neutral/negative breakdown work great next to your usual metrics like resolution time. Gives you the full picture instead of just half the story.
Look at your numbers AND what customers actually say - that's where the real story is. Maybe your resolution times look amazing, but people are complaining about repeating themselves constantly. Speed targets hit? Great. But if the feedback shows agents are rushing through calls and missing stuff, you've got a problem. Numbers tell you *what's* happening, comments tell you *why*. Honestly, I've seen too many teams celebrate metrics while customers are fuming. Both pieces together show you if those quick wins are just band-aids or if you're actually making people happy. Focus your training on whatever gap hurts most.
Look at what customers actually complain about - that's your roadmap right there. Pull themes from your surveys and complaints to see the real pain points. Maybe it's long hold times, maybe agents don't know their stuff. Plot twist: half the time we're not even tracking what bugs them most! Weight your metrics based on their feedback. Customers keep saying agents are rude? Focus on courtesy scores instead of obsessing over call duration. I'd start by digging through last quarter's feedback and matching your top 3 complaints to actual measurable stuff. It's way more telling than whatever we think matters.
Tableau and Power BI are your go-to options here. Power BI's probably the winner if you're using Microsoft stuff - everything just clicks together nicely. Qlik Sense handles real-time data super well too. Actually, NICE Analytics and Calabrio are worth checking out since they're made specifically for contact centers (though they might be overkill depending on your setup). I'd honestly just start with whatever connects easiest to your current call center system. Way less headache that way.
Look, this dashboard thing is actually pretty sweet - it turns all your quality data into something you can actually use for business decisions. Say customer satisfaction keeps tanking around returns? That's telling you to fix your return policy or retrain people. You'll spot trends that help with staffing and figuring out which training programs are worth a damn. Way better than just winging it honestly. I'd use those trends to plan quarterly stuff and connect quality wins directly to revenue. Makes the whole process less of a guessing game.
-
I joined SlideTeam last month and there’s no doubt that I tend to find our bond only strengthening over time. Best place to find world-class themes, templates, and icons.
-
The presentations are very helpful. I am always able to get appropriate templates for the different topics related to my profession.