

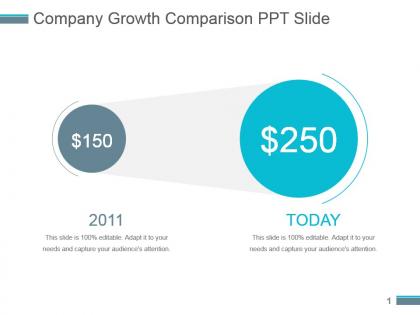
Company growth comparison ppt slide




Try Before you Buy Download Free Sample Product
 Impress Your
 Audience
 100%
100% Editable
 Save Hours
 of Time


Our Company Growth Comparison Ppt Slide create centres of excellence. You will be exceptional in any endeavour.
People who downloaded this PowerPoint presentation also viewed the following :
Company growth comparison ppt slide with all 5 slides:
Keep constraints away with our Company Growth Comparison Ppt Slide. Don't let them hamper your action.




FAQs for Company growth
Start with revenue growth - that's what really matters when you're sizing up companies. Customer acquisition costs vs lifetime value are huge too. If it's subscription-based, obviously look at monthly/annual recurring revenue. Market share trends tell you if they're actually winning or just riding a wave. Honestly, employee growth can be sneaky useful - though sometimes the best companies grow revenue way faster than headcount (total win). Gross margins expanding over time? Chef's kiss. Just make sure you're comparing similar companies in the same timeframe. Pick like 3-4 metrics max or you'll go crazy with analysis paralysis.
So here's the thing - market conditions are like a tide that lifts or sinks everything, but not equally. You can't just compare raw growth numbers without considering if it was a boom or crash period for that sector. A company might look amazing just because they caught a lucky wave. Others seem slow but actually crushed it given horrible conditions. Honestly reminds me of comparing race times in different weather (random analogy but whatever). What you really want is relative performance - how'd each company do versus their industry average during those exact same months? That'll give you the real picture.
Honestly, I'd track both but for different reasons. Revenue growth shows real market traction - it's way harder to fake than other metrics. But here's the thing: companies can grow revenue while losing their shirts, which obviously isn't sustainable. Profit growth matters more long-term since that's actual value being created. Problem is, it's easier to manipulate through accounting stuff or just slashing costs that'll hurt them later. Early-stage companies throw this whole thing off though - they'll burn profits on purpose to grab market share. Watch for strong revenue but shrinking margins. That combo screams trouble.
Yeah, seasonal stuff really messes with growth comparisons when you're looking at different industries. Retail goes crazy during holidays while B2B software just chugs along steadily - totally different beasts. Manufacturing and tourism have their own weird patterns too. I learned this the hard way comparing Q4 numbers once. Your best move is comparing the same time periods year-over-year, or maybe use seasonally adjusted data. Quarter-to-quarter can be super misleading if you're not careful. Annual comparisons usually work better for cross-industry stuff anyway.
So innovation drives everything - it's what separates the winners from companies that get left behind. Track your R&D spending versus revenue, patent applications, and how fast you're getting products to market. Oh, and see what percentage of revenue comes from stuff you launched in the past few years. Some companies hit 40% which is honestly insane when you think about it. Don't forget employee buy-in on innovation projects either. Markets shift constantly now, so you need to know how quickly your team can adapt. Pick maybe 3-4 metrics that actually make sense for your space instead of drowning in data.
Yeah, M&A totally screws up growth comparisons - you end up looking at completely different things. So Company A buys someone halfway through the year and boom, their revenue shoots up. But that's not real growth, it's just tacking on another company's numbers. Kinda like me saying I'm richer because I married someone with money lol. Look for "organic growth" or "same-store sales" instead of the headline numbers. Those strip out the acquisition noise. Also check when deals actually closed so you can compare the right time periods. Way more accurate picture that way.
Geographic expansion can completely shift your competitive game. You'll tap into fresh revenue and spread out risk instead of staying stuck in oversaturated markets. Getting there first usually means snagging market share before everyone else piles in. But here's the thing - execution is where most companies mess up. Bad timing or wrong market choices can actually hand your competitors an advantage while you're burning cash. I've seen it happen way too often. You don't want to stretch yourself so thin that you lose focus on what's already working. Pick your spots carefully.
First thing - figure out what metrics actually matter for your business. Revenue growth, customer acquisition costs, market share, whatever drives your specific industry. IBISWorld and trade associations have tons of good data for benchmarking. Honestly, don't waste time on vanity metrics that look impressive but don't mean much. Pick 3-5 solid indicators and stick with those. Compare apples to apples - same time periods, account for seasonal stuff. Here's the thing though: benchmark against similar-sized companies, not the massive players. Pull your last 12 months of data first and see where you land.
Look beyond just the numbers - management quality matters way more than people think. Check out their market position, brand strength, customer loyalty. I've literally watched companies with insane growth numbers completely implode because leadership was trash. It happens so fast it's scary. Also dig into whether their growth is actually sustainable or just some temporary spike. Regulatory stuff and industry trends matter too. Honestly? Make yourself a quick checklist of these softer factors to go through alongside the financial data. Way easier than trying to remember everything.
Dude, demographics literally control everything about how fast a company can scale. Younger crowds? They'll jump on new tech instantly but don't have deep pockets yet. Older customers spend way more over time - though good luck getting them to download your app. Where people live changes the whole game too. Rural folks need totally different stuff than city people, plus they cost more to reach. I learned this the hard way at my last job. But seriously, figure out your customer mix early so you can actually predict growth and not blow your marketing budget on the wrong people.
Honestly, the biggest mistake is comparing companies that aren't even in the same league - like putting a 2-year-old startup next to some massive corporation. Makes zero sense. Cherry-picked timeframes will totally mess you up too. Growth looks completely different if you're checking pandemic years vs normal times. Oh, and make sure you're actually comparing the same stuff - revenue vs users vs whatever metric they're using. Industry matters a ton as well. What seems slow in tech could be incredible for manufacturing. Stick to similar-sized companies in the same space, same timeframes. Way more reliable that way.
Honestly, the speed you adopt new tech can totally make or break your business. Companies jumping on innovations early usually crush it with better revenue and efficiency. Meanwhile, the slow movers? They're basically watching competitors sprint past them. Early adopters grab those sweet first-mover advantages and attract better talent too. Plus they pivot way faster when things change - which happens constantly these days, let's be real. The laggards end up with shrinking margins and lose market share. You should definitely track what tech trends matter in your industry and see how you stack up against the leaders.
So retention rates are like your crystal ball for whether a company can actually sustain growth. High retention means they're keeping customers happy instead of constantly bleeding money to find new ones - way more efficient. Think of it as filling a bucket vs filling one with holes. Companies with crappy retention usually have deeper product issues that'll bite them later. Honestly, I always look for 90%+ retention in their main customer segments when I'm evaluating long-term potential. That's where you see real compounding effects happen.
Yeah, there's definitely a connection there. Companies with high engagement scores usually beat their competitors by 15-25% in revenue growth. Makes total sense though - when people actually give a damn about their work, they're more productive and stick around longer. During tough market shifts, engaged teams pivot way faster too. Honestly, I think engagement metrics are more predictive than most financial stuff when you're trying to spot which companies will keep growing. It's not just some fluffy HR thing - it actually moves the needle on performance.
Dude, don't compare raw numbers between companies - that's like comparing your monthly grocery bill to Bezos'. Use percentages instead. Growth rates, margin improvements, stuff like revenue per employee. A startup hitting $1M vs Apple hitting $1M is totally different, right? I learned this the hard way when I was analyzing tech companies last year. Create some kind of scorecard system that weighs things based on company size and industry. Also normalize everything against benchmarks so you're not comparing random timeframes. Makes way more sense that way.
-
Designs have enough space to add content.
-
Great product with highly impressive and engaging designs.