

Contact Center Metrics KPI Dashboard With Calls Data




Try Before you Buy Download Free Sample Product
 Impress Your
 Audience
 100%
100% Editable
 Save Hours
 of Time


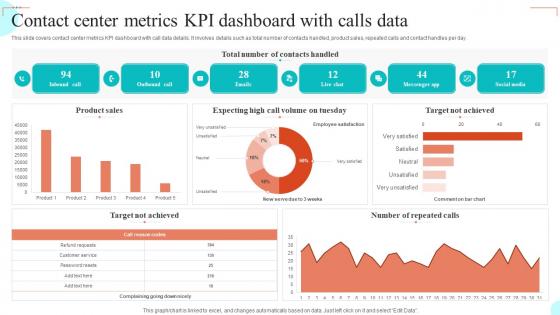
This slide covers contact center metrics KPI dashboard with call data details. It involves details such as total number of contacts handled, product sales, repeated calls and contact handles per day.
People who downloaded this PowerPoint presentation also viewed the following :
Contact Center Metrics KPI Dashboard With Calls Data with all 7 slides:
Use our Contact Center Metrics KPI Dashboard With Calls Data to effectively help you save your valuable time. They are readymade to fit into any presentation structure.





FAQs for Contact Center Metrics KPI Dashboard
Essential contact center KPIs include first call resolution rate, average handle time, customer satisfaction scores, agent utilization rates, and service level percentages. These metrics enable organizations to streamline operations, enhance customer experiences, and optimize resource allocation, with many contact centers finding that comprehensive dashboards ultimately deliver improved efficiency and competitive advantage.
A contact center KPI dashboard influences operational efficiency by providing real-time visibility into agent performance, call volumes, response times, and resource allocation, enabling managers to quickly identify bottlenecks and optimize staffing. Through automated reporting and predictive analytics, organizations streamline workforce management, reduce operational costs, and enhance customer experiences, with many financial services and retail companies finding that data-driven insights ultimately deliver faster resolution times and improved satisfaction scores.
Effective contact center KPI dashboard tools include Tableau, Microsoft Power BI, Salesforce Analytics, Zendesk Explore, and Genesys PureCloud Analytics. These platforms streamline performance monitoring by integrating real-time data, customizable visualizations, and automated reporting capabilities, with many organizations finding that cloud-based solutions deliver enhanced scalability and cost efficiency.
Contact center KPIs should be reviewed monthly for strategic metrics like customer satisfaction and cost per contact, while operational metrics require daily or real-time monitoring for immediate response management. This balanced approach enables organizations to track long-term trends, identify emerging issues quickly, and adjust staffing or processes accordingly, ultimately delivering improved customer experiences and operational efficiency.
Real-time data serves as the foundation of effective contact center KPI dashboards by enabling instant visibility into call volumes, agent performance, customer satisfaction scores, and queue lengths. This immediate access allows managers to make swift operational adjustments, redistribute workloads, and address service disruptions proactively, ultimately delivering improved customer experiences and enhanced operational efficiency across all contact center functions.
Contact centers customize KPI dashboards by selecting metrics aligned with strategic objectives, configuring real-time alerts for critical thresholds, integrating with existing CRM systems, and creating role-specific views for different stakeholders. Through flexible dashboard platforms, organizations can prioritize customer satisfaction scores, operational efficiency metrics, and agent performance indicators, while adapting visual layouts and automated reporting schedules, ultimately delivering targeted insights that drive strategic decision-making.
Implementation challenges include data integration complexities, resistance to change from staff, selecting relevant KPIs, ensuring real-time accuracy, and managing costs across multiple systems. These obstacles can be overcome through phased rollouts, comprehensive training programs, and stakeholder engagement, with many organizations finding that starting with core metrics, investing in integration platforms, and maintaining clear communication ultimately delivers improved operational visibility and enhanced customer service performance.
Industry benchmarks influence contact center KPIs by providing performance baselines for metrics like average handle time, first-call resolution rates, customer satisfaction scores, and agent productivity levels. These benchmarks enable organizations to set realistic yet competitive targets, identify performance gaps against industry leaders, and prioritize improvement initiatives, with many contact centers finding that benchmark-driven KPIs ultimately enhance operational efficiency and customer experiences.
Agent performance metrics include first call resolution rates, average handle time, customer satisfaction scores, call abandonment rates, and quality assurance ratings. These indicators streamline workforce management by identifying training needs, optimizing scheduling patterns, and enhancing service delivery, with many contact centers finding that comprehensive performance tracking ultimately delivers improved customer experiences and operational efficiency.
Customer feedback integrates into contact center KPI dashboards through automated survey data collection, sentiment analysis tools, real-time feedback widgets, social media monitoring systems, and post-interaction rating mechanisms. These technologies streamline feedback aggregation by connecting multiple touchpoints, analyzing customer emotions, and correlating satisfaction scores with agent performance metrics, ultimately delivering comprehensive insights that enhance service quality and operational efficiency.
Dashboards help identify trends and patterns by consolidating historical interaction data, call volumes, resolution times, and satisfaction scores into visual analytics that reveal seasonal fluctuations, peak demand periods, and emerging issues. Through real-time monitoring and comparative analysis, contact centers can anticipate staffing needs, optimize resource allocation, and proactively address recurring customer concerns, ultimately enhancing operational efficiency and service quality.
A KPI dashboard aids workforce management by tracking agent performance metrics, monitoring call volumes and wait times, analyzing scheduling efficiency, and identifying training needs in real-time. Through automated reporting and predictive analytics, contact centers can optimize staffing levels, reduce operational costs, and improve customer satisfaction scores, while managers gain actionable insights that enable strategic resource allocation and enhanced service delivery.
Effective contact center KPI dashboard visuals include real-time gauge charts for service levels, color-coded heat maps for agent performance, trend line graphs for call volumes, and digital scorecards for key metrics. These visual elements enhance operational visibility by enabling instant performance assessment, identifying bottlenecks quickly, and facilitating data-driven decisions, with many contact centers finding that intuitive visual displays significantly improve response times and customer satisfaction.
Contact center type significantly influences KPI selection, with inbound centers prioritizing metrics like average handle time, first call resolution, and customer satisfaction scores, while outbound centers focus on call conversion rates, contact rates, and revenue per call. Healthcare contact centers emphasize appointment scheduling efficiency and patient satisfaction, whereas sales-focused outbound operations track lead conversion and campaign ROI, ultimately delivering targeted performance insights that align with each center's strategic objectives.
Automation significantly streamlines dashboard development by enabling real-time data integration, reducing manual reporting tasks, and automatically updating key metrics like response times and resolution rates. Through automated data collection and visualization tools, contact centers achieve faster deployment, enhanced accuracy, and continuous monitoring capabilities, while minimizing resource requirements and ultimately delivering more responsive customer service insights.
-
Incredibly beautiful designs that will help you get noticed! These eye-catching templates are perfect for corporate presentations that can be altered to fit any occasion or taste.
-
SlideTeam’s pool of 2Million+ PPTs has really benefited my team, everyone from the IT department to HR. We are lucky to have crossed ways with them.