


KPI Dashboard Showing Inbound And Outbound Calls Summary





Try Before you Buy Download Free Sample Product
 Impress Your
Audience
 100%
Editable
 Save Hours
of Time


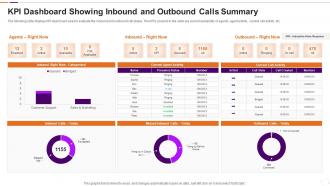
The following slide displays KPI dashboard used to evaluate the inbound and outbound call status. The KPIs covered in the slide are current availability of agents, agent activity, current call activity etc.
People who downloaded this PowerPoint presentation also viewed the following :
KPI Dashboard Showing Inbound And Outbound Calls Summary with all 7 slides:
Use our KPI Dashboard Showing Inbound And Outbound Calls Summary to effectively help you save your valuable time. They are readymade to fit into any presentation structure.






FAQs for KPI Dashboard Showing Inbound And
Focus on visual hierarchy first - put your most important stuff where people look right away. Pick your core KPIs and don't go crazy adding everything (seriously, less is more here). Group similar metrics together with consistent colors and fonts. Mobile-friendly is non-negotiable since we're all glued to our phones anyway. Real-time updates sound impressive but honestly? Hourly refreshes work fine for most things. Test it with a few people before you launch - they'll catch weird stuff you totally missed. Clean design beats flashy every time.
Honestly, just ask each person what 3-5 metrics they actually check every day - that's your starting point. Executives want the big picture stuff like revenue growth, while department heads need operational data they can act on. Sales teams obsess over pipeline numbers, HR tracks retention, finance lives in the margins. I swear half the dashboards I've seen are just data dumps that nobody uses. The whole point is matching what people see to what they actually need for decisions. Short sentences work better than cramming everything together, and don't make everyone look at the same generic view.
First thing - figure out what actually matters for your business. Revenue? Customer happiness? Don't get sucked into tracking fancy metrics that just look good on paper. I've seen way too many dashboards packed with useless data that nobody ever acts on (honestly, it's kind of painful). Stick to maybe 5-7 metrics max so people can actually focus. Each one needs an owner who's gonna be responsible for moving it. Here's the real test though - can your team look at these numbers and make actual decisions? If not, you're probably tracking the wrong stuff.
Honestly, good visualizations make such a huge difference for dashboards. Instead of staring at endless rows of numbers, you can actually see what's happening. Gauges work great for showing if you're hitting targets, and trend lines are perfect for tracking stuff over time. I'm a big fan of color coding too - red/green makes problems super obvious at a glance. Heat maps are clutch for spotting patterns quickly. The whole point is making it brain-dead simple for anyone to understand without squinting at spreadsheets. Pick maybe 2-3 chart types that fit your KPIs best and run them by your team first.
So Tableau, Power BI, and Google Data Studio are the big names everyone uses. Excel's still everywhere but kinda sucks for anything real-time. If you've got money to burn, there's Klipfolio, Sisense, Looker - that whole crew. Honestly? I'd go with Power BI or Google Data Studio first. They're cheap and won't make your head explode trying to figure them out. Just pick whatever plays nice with your current data setup and matches how tech-savvy your team actually is. Oh, and start with whatever you can get your hands on now - you can always switch later when things get messier.
Honestly, daily updates work best for most operational stuff. Financial metrics? Maybe weekly or monthly is fine. But website traffic and sales - yeah, you'll want those updated daily or even real-time. I've watched teams go crazy updating everything every hour (waste of time, trust me), then they completely miss the bigger trends because there's too much noise. Match your update schedule to how fast you can actually do something about it. Start simple with whatever your team can handle, then tweak it based on what actually helps you make decisions.
Honestly, user feedback makes the difference between a dashboard people actually use vs one that just sits there looking nice. Ask them what's confusing or missing - like monthly check-ins or quick surveys work great. I've watched so many beautiful dashboards die because they didn't match how people really work. Your users will tell you which metrics aren't helpful, what charts are hard to read, and where navigation sucks. They know their workflow better than you do, so their input is gold for figuring out what needs fixing.
So you'll want to start by picking just one or two KPIs that really matter - don't go crazy at first. Tools like Tableau and Power BI actually have decent ML stuff built right in now, which is pretty convenient. For sales forecasting, linear regression usually does the trick. Customer churn prediction? That's where you might need something more sophisticated. The biggest thing is making sure your data isn't a mess before feeding it to any model. I'd say test whatever predictions you get against real results for a few months first. Once you see it's actually working, then you can start adding trend lines and forecasting widgets to more dashboards.
Honestly, data quality is gonna be your biggest headache. Messy data makes everything pointless. Different teams will all want their own metrics tracked, which gets chaotic real quick - marketing wants one thing, sales wants another. Integration between systems can be brutal too, especially when they're not designed to work together. I'd say figure out your must-have KPIs first. Don't get distracted by making it look pretty until you know what actually needs measuring. Oh, and good luck getting everyone to agree on priorities - that part's more politics than tech sometimes.
Start with your main business goals and work backwards from there. Pick maybe 3-5 metrics that actually matter for revenue or customer happiness - honestly, most dashboards are just stuffed with useless vanity metrics that look impressive but tell you nothing. Leading indicators beat lagging ones when you can swing it since they predict what's coming. Oh, and make sure your team can actually do something about the numbers you're tracking. What's the point otherwise? Set up monthly check-ins to see if these KPIs still make sense or if you need to swap them out.
You absolutely need real-time data because waiting days or weeks to spot issues is basically useless. Like, if your conversion rates are crashing right now, you want to know immediately - not next Tuesday when the damage is already done. Stale data turns your dashboard into this pretty but pointless thing that just shows you what already happened. During big campaigns or launches, real-time insights let you pivot fast when something's working (or totally bombing). Set up alerts for your biggest KPIs so you're not constantly refreshing screens like a maniac. Trust me, it's a game-changer.
Start with clean data sources - that's like 80% of the battle right there. Set up validation rules that catch errors before they mess up your dashboard. Someone needs to actually own each data stream (I learned this the hard way when our sales numbers were completely wrong for 3 months). Pull from verified systems only and document how you're calculating everything. Monthly audits are clutch - spot-check your KPIs against the source. Honestly, most dashboard failures happen because nobody's watching data quality. Assign stewards for each metric and create a simple monthly checklist. Trust me on this one.
Dude, mobile access is a total game-changer for getting people to actually use your KPI dashboards. Think about it - nobody wants to wait until they're back at their computer to see if their campaign is bombing. Your sales team can check numbers while they're out with clients, managers can review stuff during their commute (probably while stuck in traffic anyway). People live on their phones now, so that's where they expect to find everything. When alerts hit mobile devices, decisions happen way faster. Just make sure the thing actually works well on phones - if it's clunky to navigate with your thumb, forget it.
Yeah, cultural stuff can totally mess with how your global teams read those KPI dashboards. Japanese teams usually want all the context and background details. Americans? Just give them the numbers. Oh, and don't use red for bad metrics if you've got Chinese team members – red's lucky there, not dangerous. I made that mistake once, whoops. Some regions love those complex charts with everything on them, others just want the simple summary view. Honestly, you'll probably need different dashboard versions for different regions. Test things out with local people first though – saves you from looking like an idiot later.
Honestly, the worst thing you can do is cram like 15 different metrics on one screen - nobody wants to decode that mess. Pick 5-7 max that actually matter to your business goals. Skip the vanity stuff too (who cares about total page views if your conversion rate sucks?). Make sure your charts aren't microscopic - I've seen dashboards where you need a magnifying glass lol. Fresh data is key, so set up regular refreshes. Oh and definitely test it with real users first. Trust me, they'll spot problems you completely missed and save you from looking like an idiot later.
-
SlideTeam never fails to surprise me with its amazing PPT designs. Thanks team for providing me with your constant support!
-
Based on my personal experience, I would recommend other people to subscribe to SlideTeam. No one can be disappointed here!