


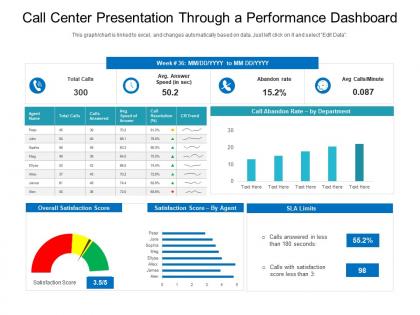
Call center presentation through a performance dashboard




Try Before you Buy Download Free Sample Product
 Impress Your
 Audience
 100%
100% Editable
 Save Hours
 of Time


Our Call Center Presentation Through A Performance Dashboard are topically designed to provide an attractive backdrop to any subject. Use them to look like a presentation pro.
People who downloaded this PowerPoint presentation also viewed the following :
Call center presentation through a performance dashboard with all 2 slides:
Use our Call Center Presentation Through A Performance Dashboard to effectively help you save your valuable time. They are readymade to fit into any presentation structure.


FAQs for Call center presentation through
Start with the big four - average handle time, first call resolution, customer satisfaction, and agent utilization. These show you what's actually happening. Abandonment rate matters too because nobody wants to sit on hold forever (learned that the hard way). Queue times and service level metrics are solid additions. Don't go crazy with too many at first though. Get your dashboard running with these basics, then add whatever else your team needs. Oh, and agent performance scores - almost forgot that one but it's pretty crucial for spotting issues early.
Honestly, real-time dashboards are a total game-changer for call centers. You can see queue buildups before customers bail, catch which agents are struggling, and spot service drops as they happen. No more finding out at 5pm that your day went to hell. The visual stuff makes patterns super obvious too - way better than staring at spreadsheets all day (trust me on that one). Set up alerts for your main metrics so you get pinged when things go sideways. It's like having eyes everywhere instead of managing blind.
Customer feedback shows you what's really happening vs just your internal numbers. You'll catch patterns - like certain agents getting bad CSAT scores or customers getting confused by processes that look fine on paper. The cool part is connecting actual sentiment to performance data. Start with survey results and map them to individual calls first. Honestly, this beats guessing why metrics look weird when customers are telling you exactly what's wrong. It's about spotting problems early before they blow up into bigger headaches.
So each platform has its own personality, you know? Salesforce gives you crazy integration options but honestly it can be a lot to handle with all that customization. Zendesk? Super clean and straightforward - which I actually love sometimes. Now Genesys and Five9 are all about those real-time analytics, so you'll see way more detailed performance stuff. Here's the thing though - whatever platform you pick, their built-in reporting basically decides which metrics are gonna be front and center. Just roll with what your platform does well instead of fighting it, then only add outside tools if you really have to.
Oh man, you'll want to focus on Average Handle Time, First Call Resolution, and Customer Satisfaction scores first - those three tell you everything about how your agents are actually doing. Quality scores from call monitoring are solid too, but honestly they can be all over the place depending on who's reviewing the calls. Here's the thing though - don't track every single metric under the sun or you'll just confuse yourself. Stick with those four main ones. Review them weekly with your team so everyone knows where they stand and what needs work.
You'll want to check your performance dashboard - it breaks down exactly where agents are messing up. Look at call resolution rates, customer satisfaction, handle times, all that stuff. When I see multiple agents bombing first-call resolution, that's usually a dead giveaway they need process training. The visual layout makes patterns super obvious. Plus you can stack individual performance against team averages to figure out who needs one-on-one coaching vs. everyone needing the same training. I'd pull these monthly instead of doing those generic training sessions that nobody really learns from anyway.
You really need that historical data - it's what makes sense of all those real-time numbers flying around. Without it, you're just staring at metrics with zero context about whether they're actually decent or completely awful. Pull at least 6 months of past performance so you can spot patterns and set realistic benchmarks. Trust me, this stuff helps you predict when things get crazy busy. Plus you'll know how to set up alerts that actually matter instead of random thresholds. It's honestly like having a roadmap instead of just wandering around blind.
So you'll want to pull data from your post-call surveys, CSAT scores, and NPS ratings - then plot them over whatever timeframe makes sense. Daily, weekly, monthly, whatever. Charts make it way easier to catch patterns before they blow up into real problems. Segment everything by agent, department, or call type so you can see who's crushing it and where things need help. Honestly, the automated alerts are a game changer - set them up when scores drop below your threshold. Way better than finding out about issues three weeks later when you're looking at monthly reports like "oh crap, when did this happen?"
Honestly, you need those benchmarks or you're just guessing if you're doing well. Like, a 75% satisfaction score sounds decent until you find out everyone else is hitting 85% - then you're screwed. Industry reports (I pull them quarterly) help you figure out realistic goals and where to actually focus. Leadership loves seeing external data too when you're asking for money. Compare stuff like handle time, first call resolution, and customer satisfaction. Oh and those industry averages? They're usually in the quarterly reports most companies put out.
Okay so basically a call center dashboard shows you what's happening with your team in real time. No more guessing if things are falling apart! You can see stuff like how long calls are taking, how many people are waiting, who's available - all on one screen. Pretty handy actually. When you notice bottlenecks forming, you can move people around before everything goes to hell. Same with spotting agents who might need extra training. My advice? Don't try to track everything at once. Pick maybe 3 or 4 metrics that actually matter for your goals and start there.
Honestly, the worst thing you can do is cram like 15 different metrics on one screen - nobody knows where to look. Skip the vanity stuff that just makes executives feel good but doesn't actually help your agents get better at their jobs. Make sure you involve people who actually take the calls when building this thing (can't tell you how many useless dashboards I've seen from managers who've never touched a headset). Also, check your data refresh rates because stale numbers are basically worthless. Stick to maybe 5-7 metrics that matter and keep everything updating live.
So call volume is basically the puppet master for everything else on your dashboard. High volume hits and boom - wait times shoot up, people hang up more, and agents start rushing through calls so first-call resolution tanks. It's honestly pretty predictable once you see it happen a few times. Low volume periods flip the script though - better service but then your agents might be sitting around twiddling their thumbs. The dashboard updates this stuff in real-time, which is actually super helpful for catching those Monday morning chaos moments or holiday spikes. Just watch your volume forecasts and you can usually predict how everything else will move.
Totally! Just focus on what each team actually needs day-to-day. Agents want the real-time stuff - queue times, resolution rates, that kind of thing. Supervisors need the team overview plus coaching alerts. Managers? They're all about trends and forecasting - the big picture analysis. Honestly, the best approach is just asking each team what they actually look at every day, then customize the widgets and filters around that. Don't overwhelm them with data they'll never use. Short sentences work great for agents who need quick info, while managers usually want more detailed views they can dig into.
Focus on real-time performance metrics and call volume first - that's your foundation. Agent scorecards let people track their own progress, while manager dashboards help spot coaching moments. Quality assurance reports are honestly non-negotiable unless you want to guess how your team's actually performing. Set up automated alerts when things go sideways with your metrics. Oh, and make sure the right people can access the right data levels - sounds obvious but you'd be surprised how often that gets messed up. Build reports that actually make people take action, not just look pretty.
Honestly, performance dashboards are a game-changer for workforce stuff. Real-time data shows you exactly when call volume spikes and which agents are killing it vs. struggling. You'll finally stop overstaffing during dead hours or panicking when things get crazy busy. The scheduling becomes so much easier when you can see patterns. Track things like handle time and resolution rates too - super helpful for figuring out who needs extra training. Oh, and definitely set up alerts when metrics go wonky so you're not constantly watching screens. Makes reacting to problems way faster.
-
Designs have enough space to add content.
-
Excellent template with unique design.
-
Easily Understandable slides.
-
Design layout is very impressive.
-
Great designs, Easily Editable.