Continuous Improvement Powerpoint Presentation Slides
Achieve operational excellence with our creatively designed Continuous Improvement PowerPoint Presentation Slides. This business operational excellence framework presentation deck includes a set of professionally designed PowerPoint templates such as company history of operational excellence capabilities, evaluate the existing operational gaps, design an evaluation process, ensure continuous improvement, implementing regional operations, analytics of achieving operational excellence, monitor performance, etc. Not only this, to cover all the important concepts our designers have included additional templates e.g. our target, mission and vision, timeline, target, thank you, financial charts, etc. Outline the factors that make continuous improvement successful. The process improvement methodology PPT slideshow have all visually appealing graphics with in-depth researched content. Furthermore, with the support of our evaluation process presentation design, you can portray various concepts like strategy deployment, performance management, continuous improvement, organizational excellence, process excellence, leading people and culture, etc. Download the business improvement process presentation deck for evaluation and improving business processes. Increase the inflow with our Continuous Improvement Powerpoint Presentation Slides. Ensure good ideas continue to be generated.
Achieve operational excellence with our creatively designed Continuous Improvement PowerPoint Presentation Slides. This bus..
- Google Slides is a new FREE Presentation software from Google.
- All our content is 100% compatible with Google Slides.
- Just download our designs, and upload them to Google Slides and they will work automatically.
- Amaze your audience with SlideTeam and Google Slides.
-
Want Changes to This PPT Slide? Check out our Presentation Design Services
- WideScreen Aspect ratio is becoming a very popular format. When you download this product, the downloaded ZIP will contain this product in both standard and widescreen format.
-

- Some older products that we have may only be in standard format, but they can easily be converted to widescreen.
- To do this, please open the SlideTeam product in Powerpoint, and go to
- Design ( On the top bar) -> Page Setup -> and select "On-screen Show (16:9)” in the drop down for "Slides Sized for".
- The slide or theme will change to widescreen, and all graphics will adjust automatically. You can similarly convert our content to any other desired screen aspect ratio.
Compatible With Google Slides

Get This In WideScreen
You must be logged in to download this presentation.
PowerPoint presentation slides
Presenting this set of slides with name - Continuous Improvement Powerpoint Presentation Slides. This PPT deck displays twenty slides with in-depth research. Our topic oriented Continuous Improvement Powerpoint Presentation Slides presentation deck is a helpful tool to plan, prepare, document and analyze the topic with a clear approach. We provide a ready to use deck with all sorts of relevant topics subtopics editable templates, charts and graphs, overviews, analysis templates. PPT slides are accessible in both widescreen and standard format. PowerPoint templates are compatible with Google Slides. Quick and risk-free downloading process. It can be easily converted into JPG or PDF format
People who downloaded this PowerPoint presentation also viewed the following :
Content of this Powerpoint Presentation
Slide 1: This slide introduces Continuous Improvement. State Your Company Name and begin.
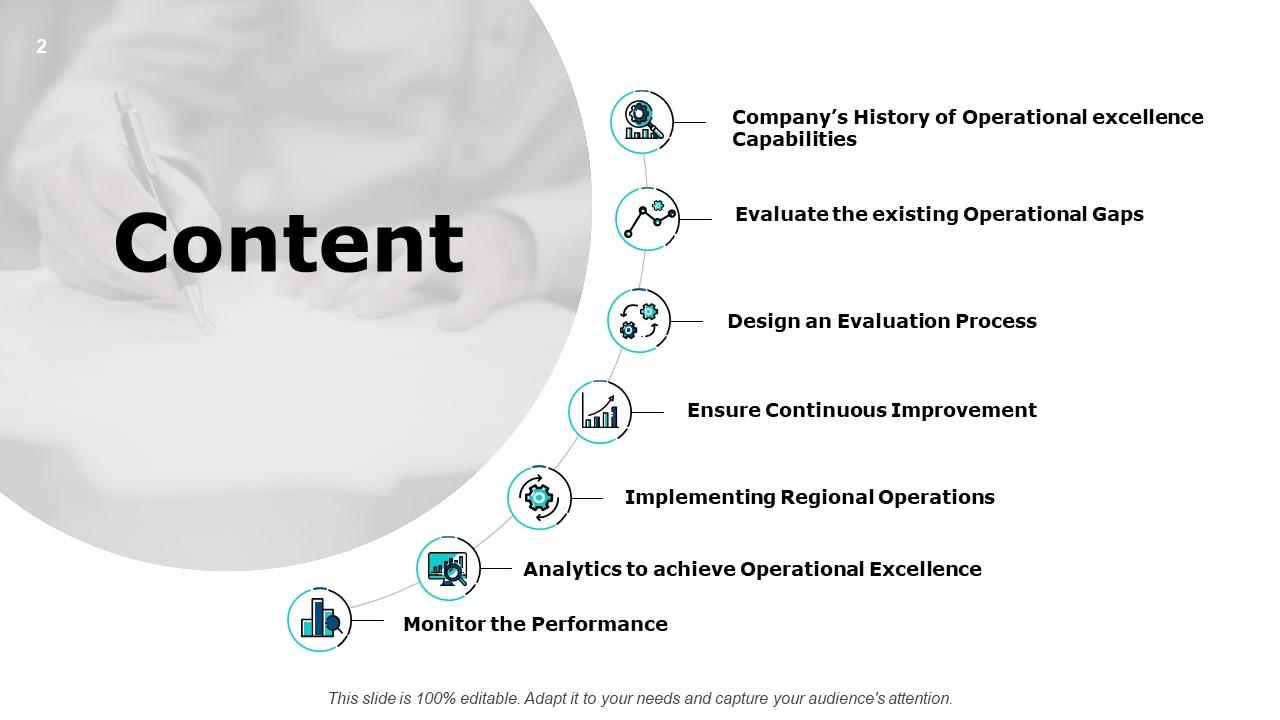
Slide 2: This slide shows Content of the presentation.
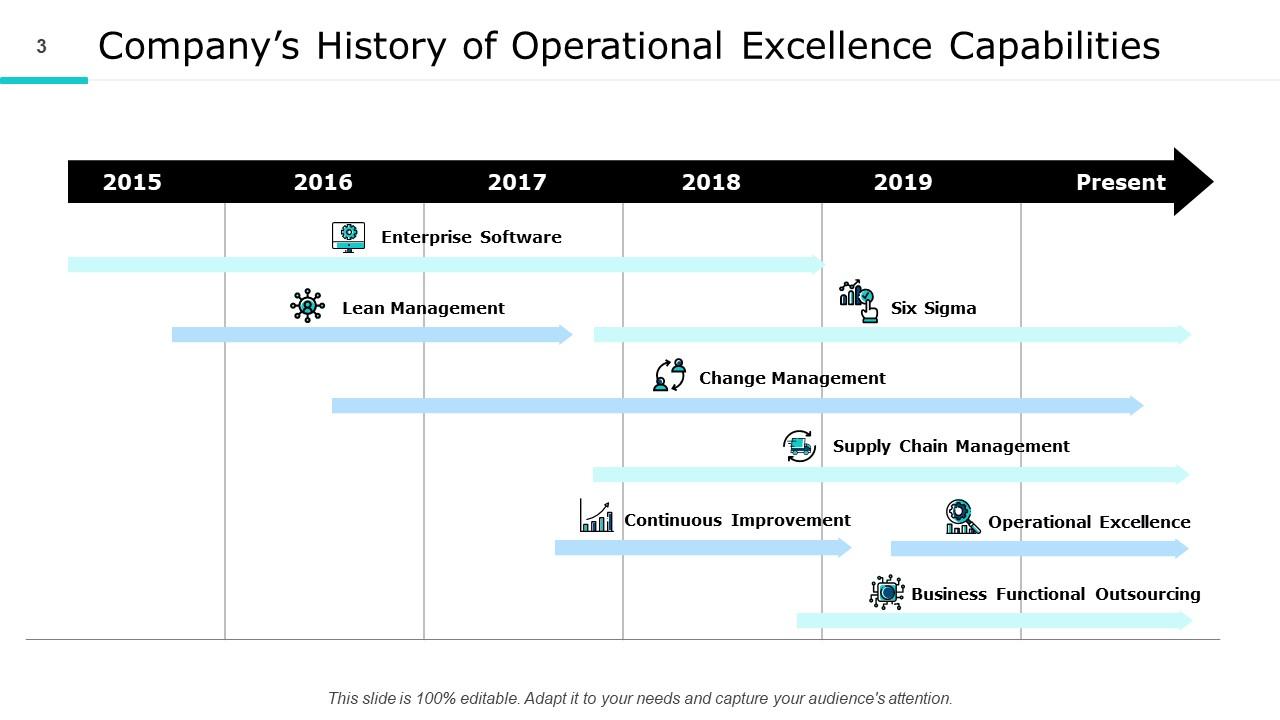
Slide 3: This slide presents Company’s History of Operational Excellence Capabilities.
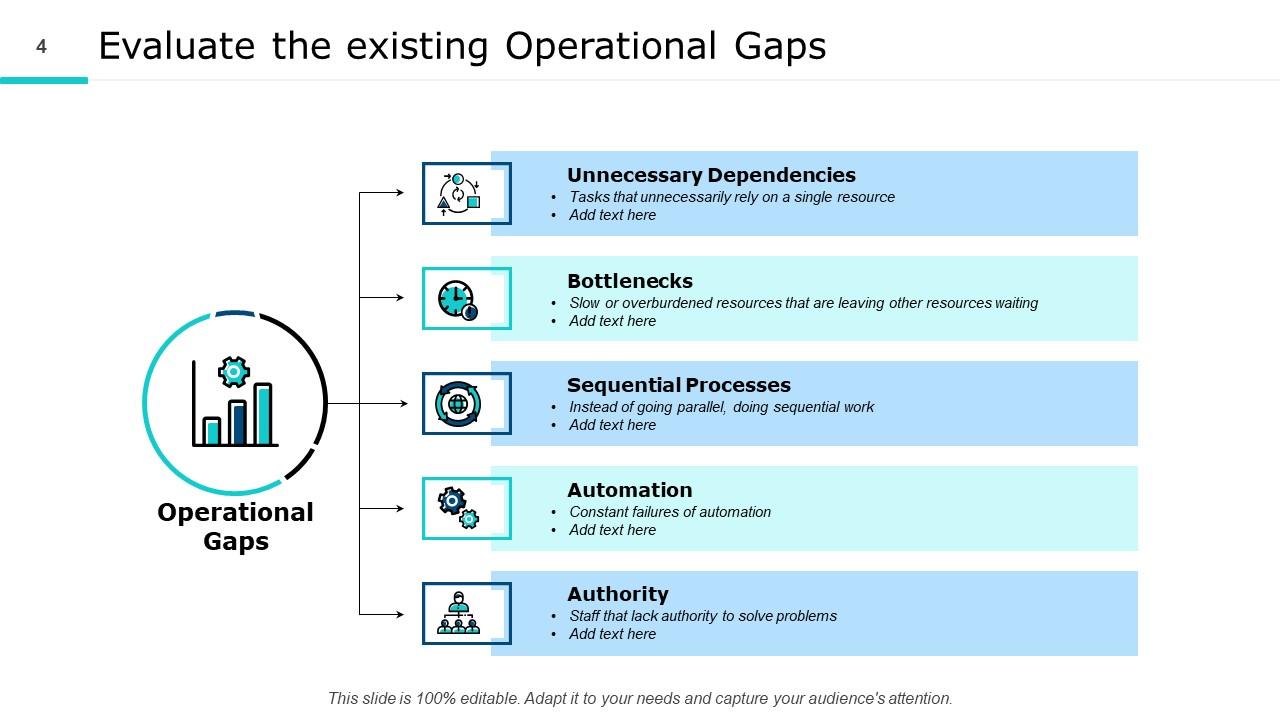
Slide 4: This slide displays Evaluate the existing Operational Gaps describing- Unnecessary Dependencies, Bottlenecks, Sequential Processes, Automation, Authority.
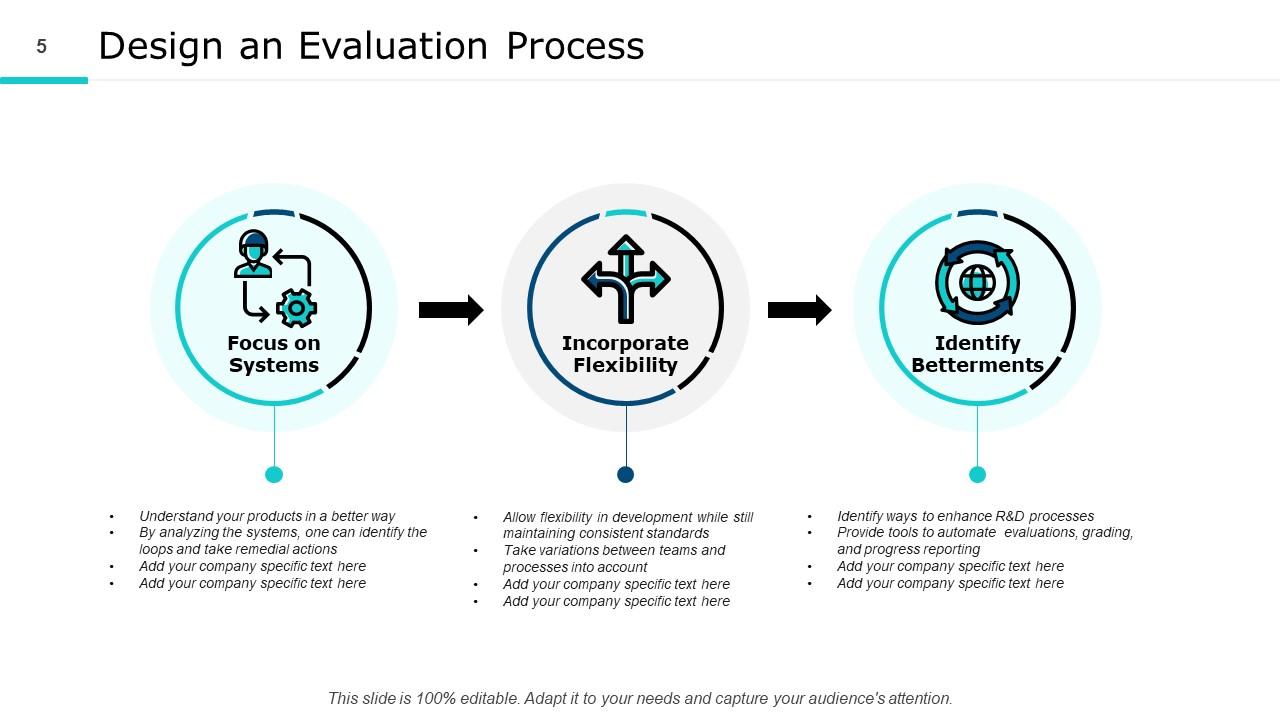
Slide 5: This slide represents Design an Evaluation Process describing- Focus on Systems, Incorporate Flexibility, Identify Betterments.
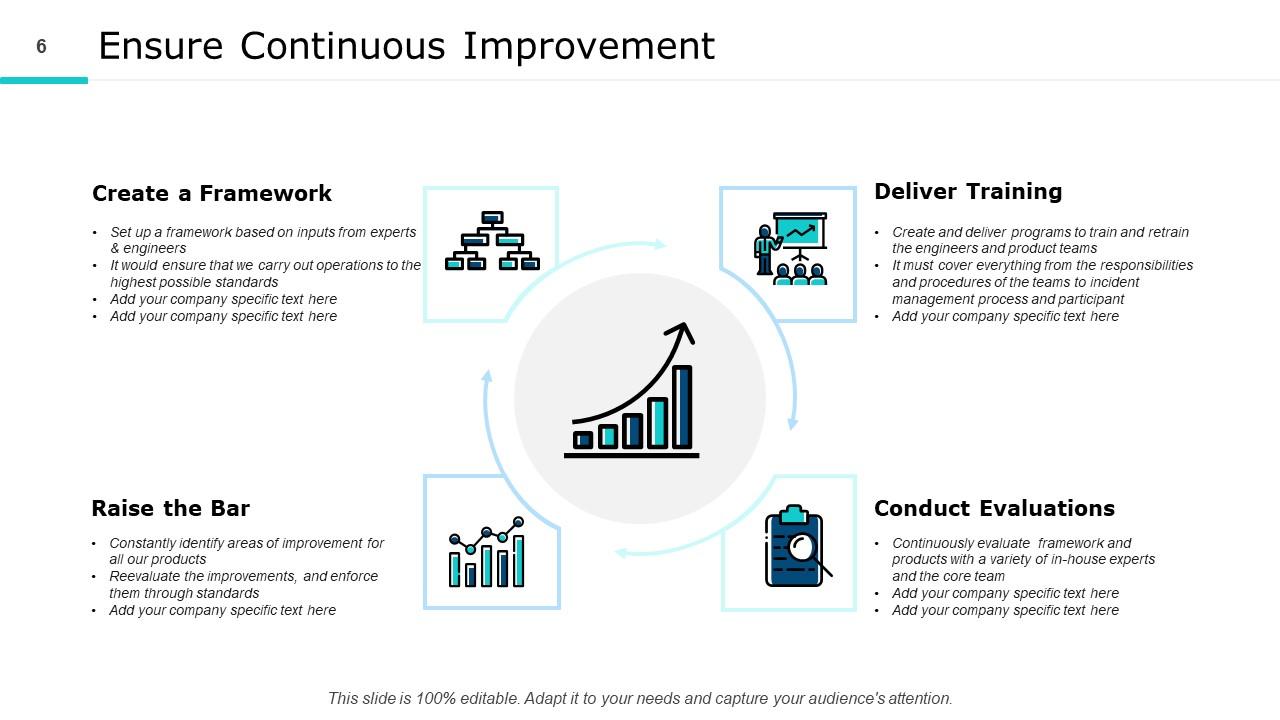
Slide 6: This slide showcases Ensure Continuous Improvement describing- Deliver Training, Create a Framework, Raise the Bar, Conduct Evaluations.
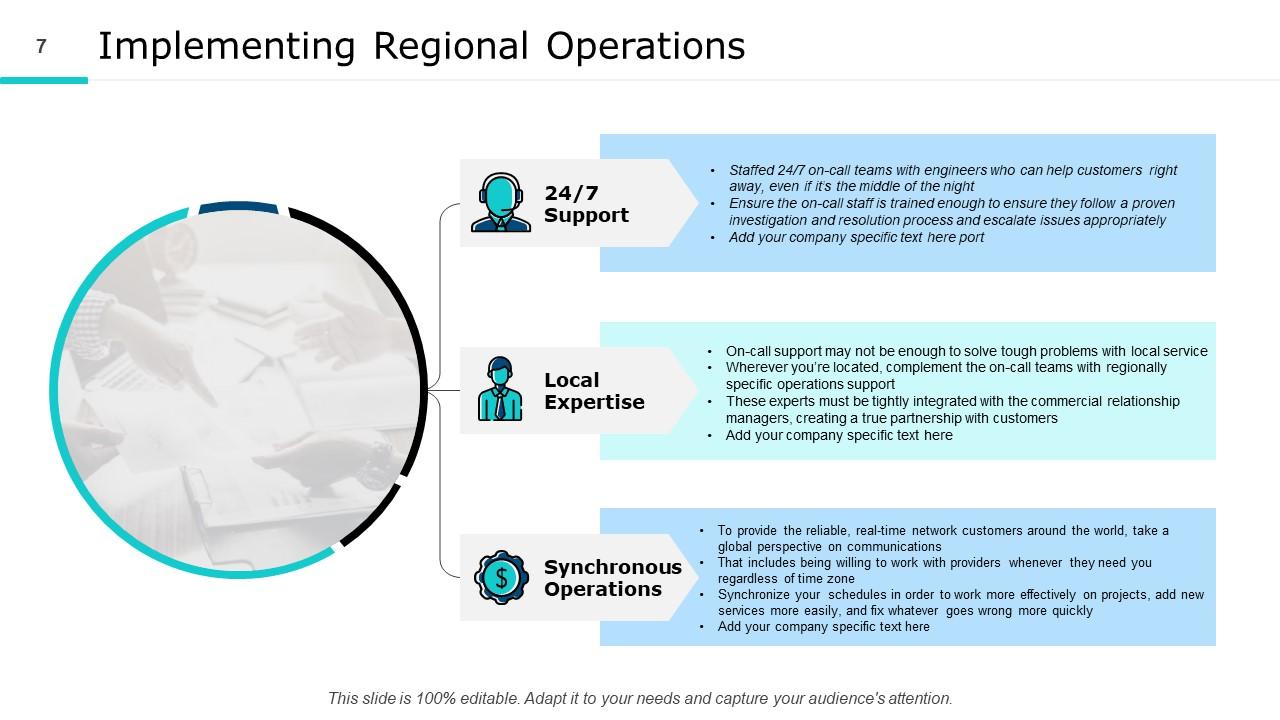
Slide 7: This slide shows Implementing Regional Operations describing- 24/7 Support, Local Expertise, Synchronous Operations.
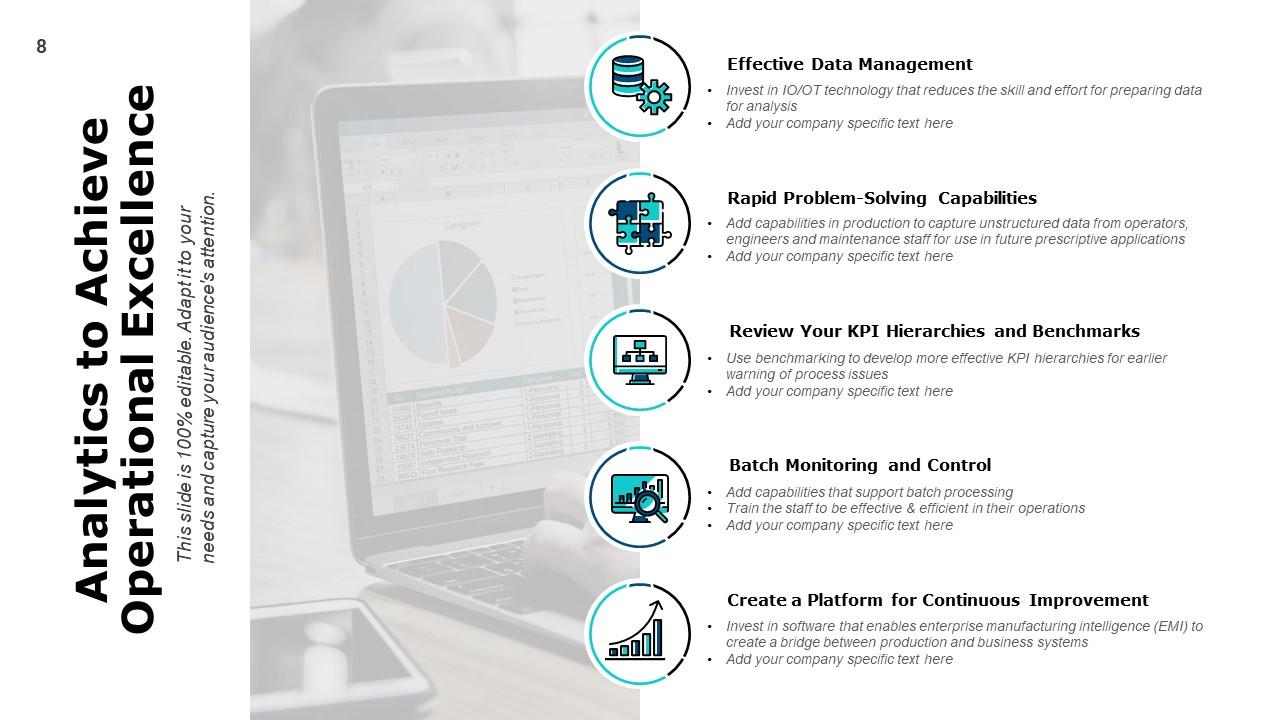
Slide 8: This slide presents Analytics to Achieve Operational Excellence describing- Effective Data Management, Rapid Problem-Solving Capabilities, Review Your KPI Hierarchies and Benchmarks, Batch Monitoring and Control, Create a Platform for Continuous Improvement.
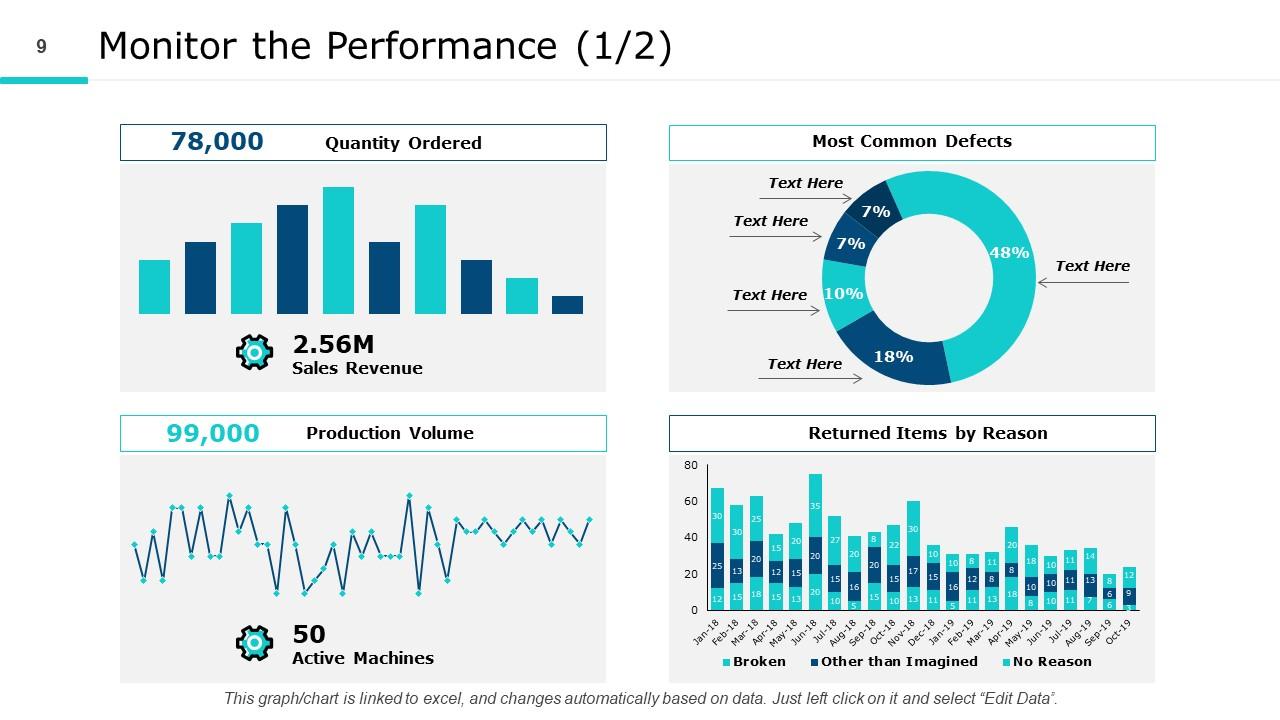
Slide 9: This slide displays Monitor the Performance with the help of graphs describing- Production Volume, Quantity Ordered, Returned Items by Reason, Most Common Defects.
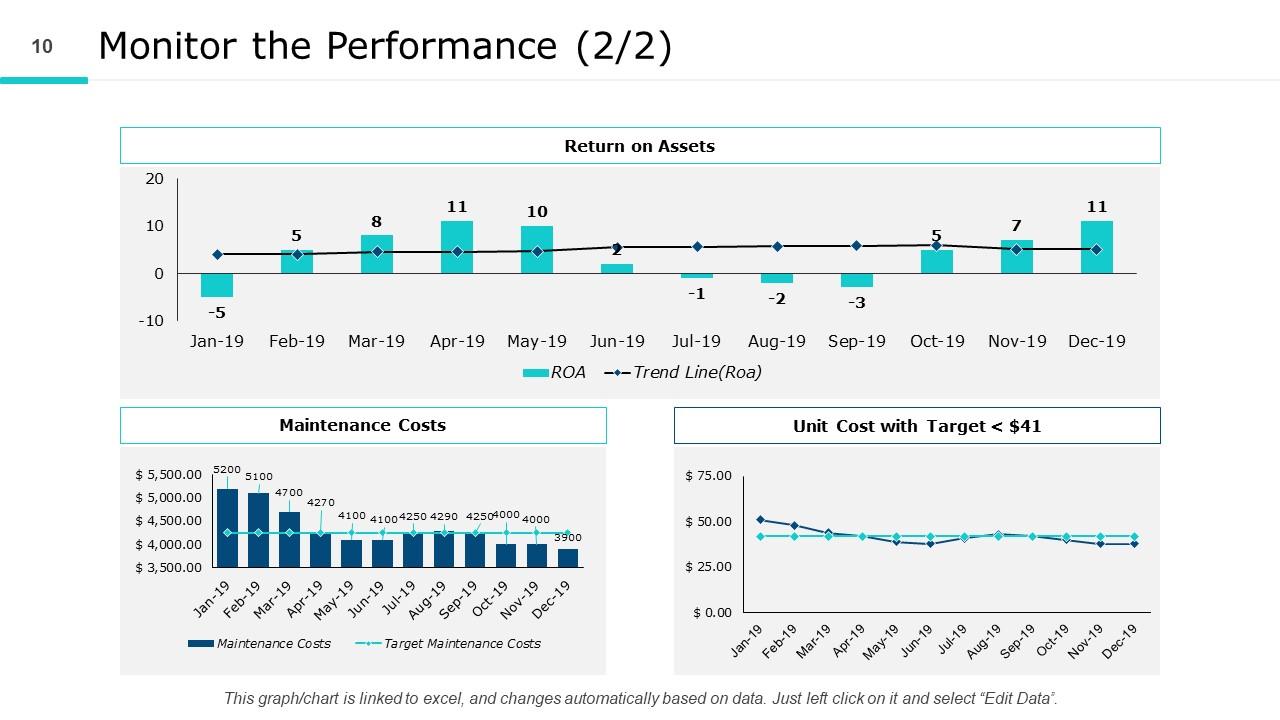
Slide 10: This is another slide on Monitor the Performance showing- Unit Cost with Target, Maintenance Costs, Return on Assets.
Slide 11: This slide showcases Operational Excellence for Icons.
Slide 12: This slide is titled as Additional Slides for moving forward.
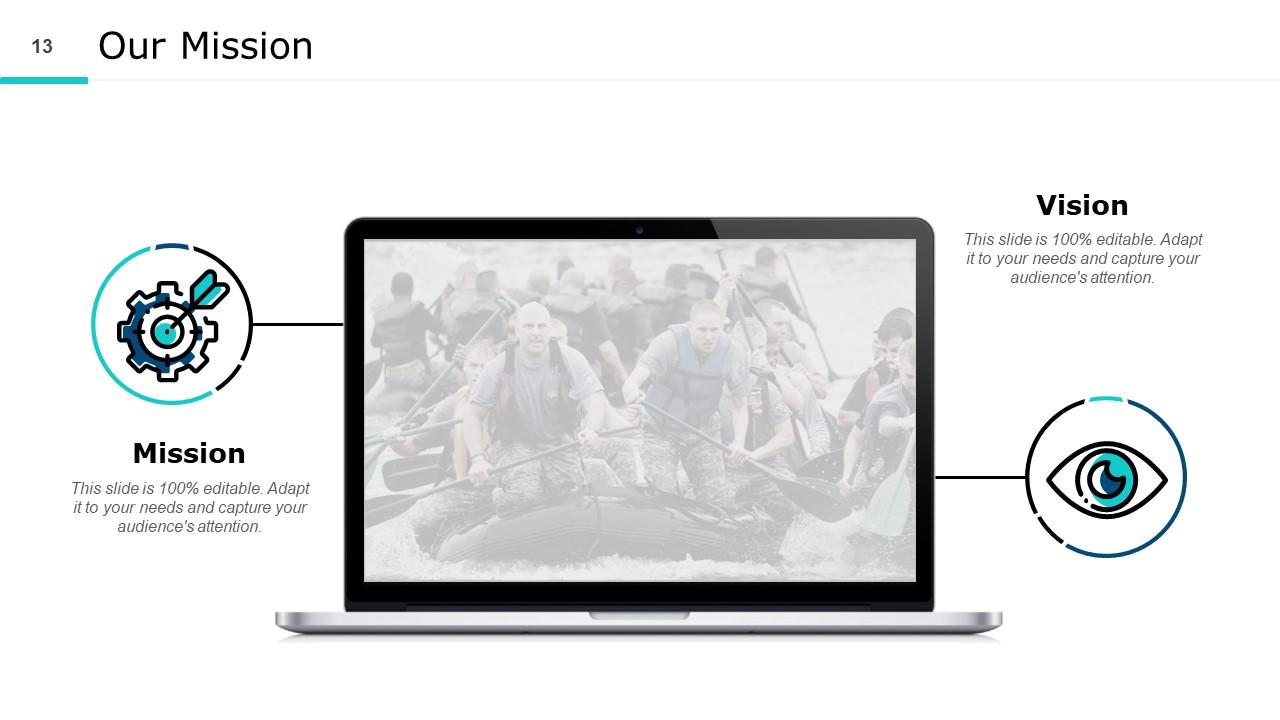
Slide 13: This is Our Mission slide with related imagery and text.
Slide 14: This is Our Target slide. State your targets here.
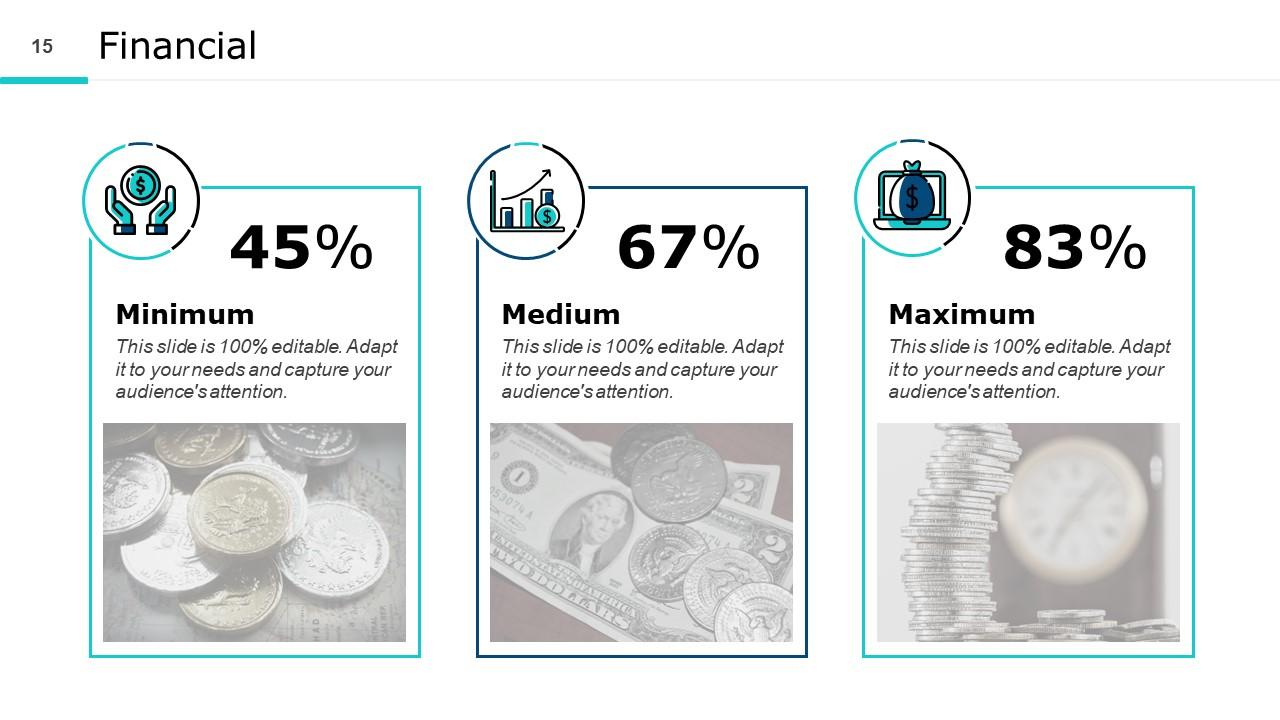
Slide 15: This is a Financial slide. Show your finance related stuff here.
Slide 16: This is a Bulb or Idea slide to state a new idea or highlight information, specifications etc.
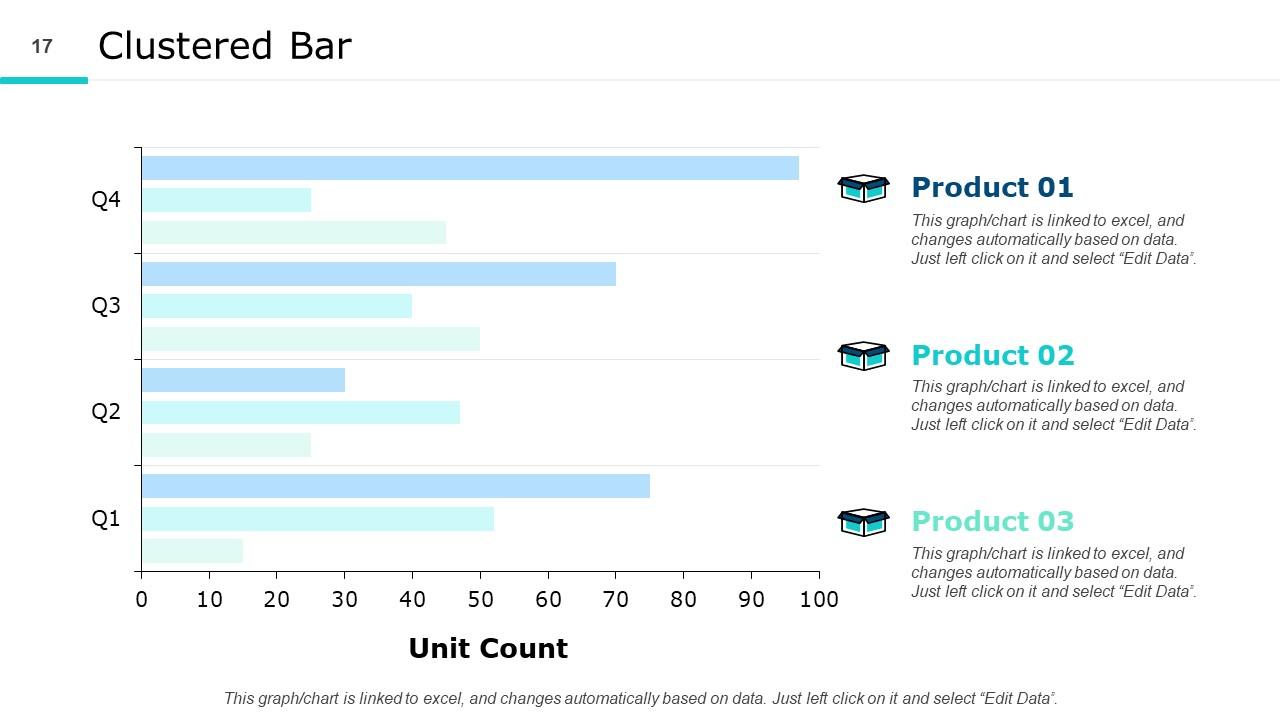
Slide 17: This slide shows Clustered Bar chart with three products comparison.
Slide 18: This slide presents Volume-Open-High-Low–Close-Chart.
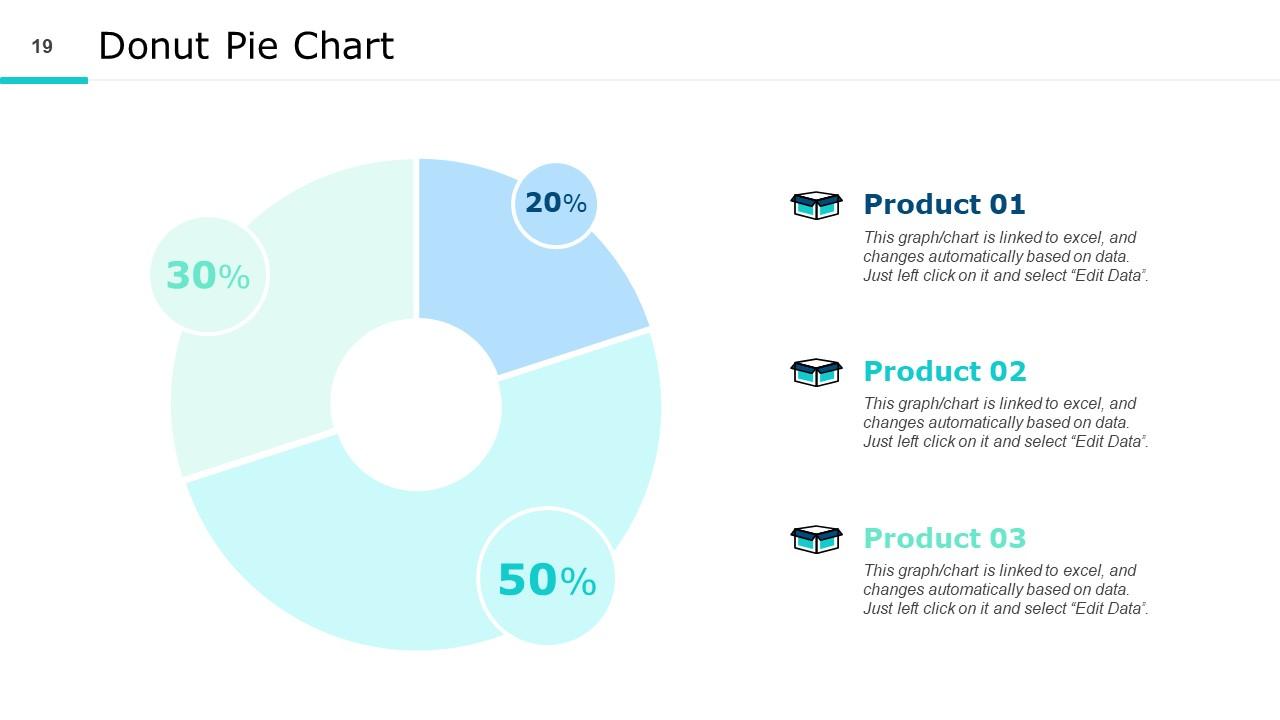
Slide 19: This slide displays Donut Pie Chart with three products comparison.
Slide 20: This is a Thank you slide with address, contact numbers and email address.
Continuous Improvement Powerpoint Presentation Slides with all 20 slides:
Applause is never grudging with our Continuous Improvement Powerpoint Presentation Slides. Folks will eagerly appreciate your brilliance.
No Reviews


