


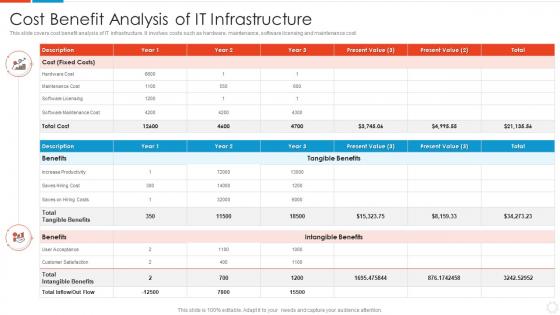
Cost Benefit Analysis Of It Infrastructure




Try Before you Buy Download Free Sample Product
 Impress Your
 Audience
 100%
100% Editable
 Save Hours
 of Time


This slide covers cost benefit analysis of IT infrastructure. It involves costs such as hardware, maintenance, software licensing and maintenance cost.
People who downloaded this PowerPoint presentation also viewed the following :
Cost Benefit Analysis Of It Infrastructure with all 6 slides:
Use our Cost Benefit Analysis Of It Infrastructure to effectively help you save your valuable time. They are readymade to fit into any presentation structure.





FAQs for Cost Benefit Analysis
Start by listing every cost - upfront stuff, monthly expenses, and those sneaky hidden fees that always pop up. Then figure out all your benefits: direct money coming in, what you'll save, plus the harder-to-measure things like better brand reputation. You gotta put dollar signs on everything, even the fuzzy benefits (this part's honestly kind of annoying but necessary). Don't forget timing matters - money now beats money later. Run the ROI or NPV calculations to see if it's actually profitable. Oh, and definitely do sensitivity analysis because some of your guesses will be totally off.
Honestly, there are a few solid ways to put dollar signs on the fuzzy stuff. Survey people about what they'd actually pay for the benefit - that's contingent valuation. Proxy metrics work great too. Like, employee satisfaction? Track how much you save on turnover costs. Brand reputation improvements can be measured through market research data (though that gets a bit messy). Environmental stuff has the travel cost method, but that's pretty specialized. The trick is finding something measurable that ties back to your qualitative benefit. Don't stress about being perfect - rough numbers beat ignoring these benefits completely.
So risk assessment is like your sanity check when doing cost-benefit analysis. You've gotta identify what could go wrong, figure out how likely it is, then put dollar amounts on those potential disasters. Otherwise you're just using fantasy numbers that never actually pan out. I usually create different risk buckets and assign probabilities to each one - helps you calculate those expected values. The boring but necessary part? Write down your assumptions so everyone knows what "what-if" scenarios you factored in. Trust me, stakeholders will ask.
Really depends on your data and what the bigwigs actually want to see. Got good numbers? Stick with NPV or benefit-cost ratios - executives eat that stuff up. Dealing with fuzzy social impacts or intangibles? Multi-criteria analysis works better. People overthink this way too much honestly. I've watched teams spend weeks debating methods when something basic would've done the job. Ask yourself first: what's your timeline and budget looking like? How precise do things really need to be? Then pick whatever fits those limits. Don't get stuck chasing the "perfect" approach when good enough gets you there faster.
Honestly, the worst thing you can do is get way too optimistic with your projections. People always forget about those sneaky hidden costs that pop up later. Don't double-count benefits or use crazy unrealistic timelines either. Risk factors? Yeah, actually factor those in - I can't tell you how many times I've seen projects get completely derailed because nobody thought about what could go wrong. And here's the thing - sunk costs don't matter for future decisions, even though it feels wrong to ignore money you've already spent. Also, don't cherry-pick data just to support what you already want to do. That's basically cheating yourself. List your assumptions first and have someone else poke holes in them.
Honestly, stakeholders mess with your CBA assumptions in a bunch of ways. Scoping meetings are where they first jump in - pushing for their pet projects to get bigger weight in the analysis. Everyone thinks their stuff matters most, which gets annoying fast. They also control what data you can actually get your hands on, so that shapes how you end up quantifying things. My advice? Write down whose assumptions you're using and why. Trust me, someone's gonna question your methodology later and you'll want that documentation. It's basically politics disguised as math sometimes.
Money today beats money tomorrow - you could invest it and make returns, obviously. That's why you've gotta discount future costs and benefits in your CBA. Convert everything to present value using a discount rate so you're actually comparing the same thing. Skip this step and you'll make terrible decisions because long-term benefits look way better than they really are. I learned this the hard way on a project that seemed incredible in year 10 but was trash once I factored in opportunity costs. Just use whatever discount rate your company normally uses or go with the cost of capital.
Honestly, proxy measures are your best friend here. Employee satisfaction? Connect it to turnover and hiring costs. Brand reputation though - that's genuinely tough to put numbers on, so just describe it and maybe use weighted scores. I've watched people drive themselves crazy trying to monetize everything when sometimes you can't. Just be upfront about your methods and what you're assuming. Document the limitations too - stakeholders are smart enough to work with uncertainty if you're transparent about it.
Oh totally! Cost benefit analysis works great for small stuff too. Don't overthink it though - like, you're not writing a dissertation here. Just throw together a quick spreadsheet comparing your main costs vs benefits. I'd say spend maybe 2-3 hours on it tops? Focus on the big ticket items instead of getting weird about every little expense. It'll help you dodge scope creep (because let's be real, that happens to everyone) and you'll actually have answers when your boss inevitably asks "why are we doing this again?" Simple template, keep it proportional to your project size, done.
Honestly? Just use Excel or Google Sheets. They'll cover like 90% of what you need for cost benefit stuff - cash flows, sensitivity analysis, NPV calculations, all that. Crystal Ball's pretty solid if you want to get fancy with Monte Carlo sims, and @RISK does decent risk modeling. There are specialized tools like CostOS but they're total overkill unless you're building airports or something. I'd say build a good template in Excel first with clear assumptions laid out. You can always upgrade later if you actually hit walls, but most people never do.
Skip the jargon and make it visual - simple charts work way better than walls of text. Start with the money stuff they actually care about: "this costs X, we'll save Y." Real dollar amounts hit harder than percentages, trust me. Tell a story instead of just throwing spreadsheets at them (executives love that narrative stuff). Don't overwhelm them - three or four main points tops. Oh, and always end with what you need from them and when. Otherwise you'll get the dreaded "let's circle back on this later."
So basically, cost-benefit puts everything in dollar terms - you spend $100k and get back $150k in benefits. Easy math. Cost-effectiveness is trickier though, you're looking at $100k to save 10 lives or cut pollution by 30%. Pick cost-benefit when you can actually convert your outcomes to money without it feeling weird. Health improvements, test scores, environmental stuff? That's where cost-effectiveness makes way more sense. Honestly, trying to slap a dollar value on saving someone's life always feels pretty gross to me. Short version: monetary outcomes = cost-benefit, everything else = cost-effectiveness.
So sensitivity analysis is basically your safety net for CBA - you test how screwed you'd be if your key assumptions are off. Change your discount rates, timelines, cost estimates, whatever keeps you up at night. See if your conclusions still make sense. Think of it like "okay but what if this number is totally wrong?" for each major variable. Honestly, it's saved me from some embarrassing recommendations before. Focus on your 3-4 biggest question marks since you can't test everything. Shows stakeholders you've actually thought this through instead of just winging it.
Okay so track your direct costs first - labor, materials, all that implementation stuff. Then add indirect costs like training and downtime (which people always forget about). For benefits, go after the solid numbers: revenue bumps, cost savings, efficiency gains. Employee satisfaction and brand stuff matter too but honestly they're a pain to measure well. Timeline's huge here - when do costs hit versus when benefits actually show up? I'd start with whatever numbers you trust most, then do some scenarios to see how sensitive everything is if your assumptions are off. Being realistic beats being optimistic every time.
At minimum, do it yearly. But honestly? Any time something big shifts in your project or market, that's when you really need to look at it again. New regulations pop up, competitors do something crazy, costs change - all that stuff makes your original numbers look pretty sketchy pretty fast. I know some teams that check quarterly on their bigger projects, though that's probably way too much for smaller stuff. Just don't wait until someone calls out your outdated numbers to realize you should've been tracking this. Set some reminders now and stay ahead of it.
-
The slides are remarkable with creative designs and interesting information. I am pleased to see how functional and adaptive the design is. Would highly recommend this purchase!
-
Mesmerized with the fantastic collection! Super sleek, relevant infographics.