


Cost Sheet Analysis Powerpoint Presentation Slides


Try Before you Buy Download Free Sample Product
 Impress Your
 Audience
Editable
of Time


Cost Sheet Analysis PowerPoint Presentation Slides helps you to establish a comparison between the different cost elements like material, labour, overheads, advertisement etc. The inventory book PPT template shows the composition of cost in a business and then classifies it into production, general & administrative and selling & distribution costs. The expense sheet PPT graphic explains the prime cost elements in detail and then shifts on the elements of overhead costs or indirect costs like production, office administrative, selling, and distribution overheads. Use the direct-indirect cost PowerPoint layout to establish an analysis for the computation of inventory cost. Analyze the results in the cost sheet with the parameters like profit volume ratio, margin safety ratio, break-even point, gross profit margin, direct material cost, direct labour cost and fixed overhead cost ratios using this cost component PowerPoint presentation. You can even make a comparison using these PPT templates between the previous year’s data on a cost sheet.
People who downloaded this PowerPoint presentation also viewed the following :
Content of this Powerpoint Presentation
Slide 1: This title slide introduces the Cost Sheet Analysis. Add the name of your company here.
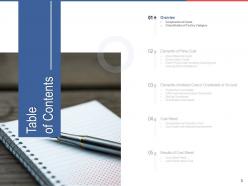
Slide 2: This slide contains the Table of Contents. It includes the Overview, Elements of Prime Cost, Elements of Indirect Cost or Overheads or On-cost, Cost Sheet, and Results of Cost Sheet.
Slide 3: This slide introduces the Overview. It includes the Composition of Costs and Classification of Cost by Category.
Slide 4: This slide presents the Composition of Costs. It consists of Prime/Direct Cost and Indirect Cost. It gives an understanding of the component of the total cost.
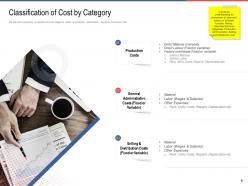
Slide 5: This slide presents the Classification of Cost by Category. The total cost of production is classified into three categories, named as Production, Administration, Selling, and Distribution Cost.
Slide 6: This slide introduces the Elements of Prime Cost. It includes Direct Material Costs, Direct Labor Costs, & Other Prime costs including Opening and Closing Stock of Material.
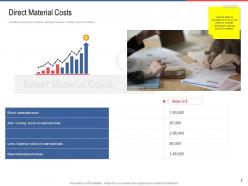
Slide 7: This slide presents the Direct Material Costs. It shows how to calculate the total cost of raw material, deducting the amount of opening stock of raw material.
Slide 8: This slide presents Direct Labor Costs. It shows how to calculate the total cost of employing workers that work directly on a manufacturing product, excluding the cost of material, opening stock, and factory overheads.
Slide 9: This slide presents Other Prime Cost Including Opening and Closing Stock of Material. It shows how to calculate the firm’s expenses directly related to material and labor used in production.
Slide 10: This slide introduces Elements of Indirect Cost or Overhead or On-cost. It includes Production Overheads, Office and Administration Overheads, Selling Overheads, and Distribution Overhead.
Slide 11: This slide presents the Production Overheads. It includes the cost incurred in manufacturing services other than the cost of direct material and services. It includes Production Overhead, agency store labor, repair & maintenance, etc.
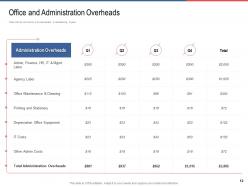
Slide 12: This slide presents the Office and Administration Overheads. These costs are not involved in the development or manufacturing of goods such as office maintenance & cleaning, IT costs, printing & stationery, etc.
Slide 13: This slide presents the Office and Administration Overheads. These costs are not involved in the development or manufacturing of goods such as office maintenance & cleaning, IT costs, printing & stationery, etc.
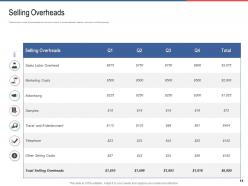
Slide 14: This slide presents the Selling Overheads. These costs are incurred to promote sales and service to customers. It includes salesman’s salaries, commission, and other expenses.
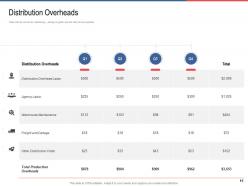
Slide 15: This slide presents Distribution Overheads. These costs are incurred for warehousing, packing for goods sent, and other service expenses.
Slide 16: This slide introduces the Cost Sheet. This includes the Computation of Inventory Cost and Cost Sheet with the detailed cost elements.
Slide 17: This slide presents the Computation of Inventory Cost. It gives a detailed analysis of the inventory of different products include information on costing and units sold.
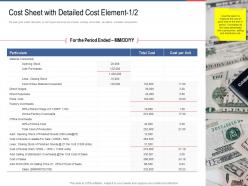
Slide 18: This is part 1 of 2 of the Cost Sheet with Detailed Cost Element. The sheet gives a detailed description of the cost of goods sold at the end of the period, including the cost of sales, raw material, overheads, and production. Use this report to measure the cost of goods sold at the end of the period.
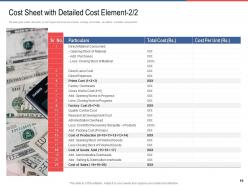
Slide 19: This is part 2 of 2 of the Cost Sheet with Detailed Cost Element. The sheet gives a detailed description of the cost of goods sold at the end of the period, including the cost of sales, raw material, overheads, and production.
Slide 20: This slide presents the Results of the Cost Sheet. This includes Cost Sheet Ratio and Cost Sheet Ratio Cont.
Slide 21: This slide presents the Cost Sheet Ratio. With the help of factory overhead, administration overhead, and selling and distribution overhead, identify the result from sales amount. Analyze the cost sheet through the results of the following parameter. It represents the sales amount in revenue terms.
Slide 22: This slide continues the Cost Sheet Ratio from the last slide. These four key performance indicator calculates a gross profit margin: Gross profit margin, direct material cost per unit, direct labor cost per unit, and fixed overhead cost per unit.
Slide 23: This is the Icons Slide for Cost Sheet Analysis for you to choose from.
Slide 24: This slide presents Additional Slides.
Slide 25: This slide shows the members of the company team with their name, designation, and photo.
Slide 26: This slide provides the Mission for the entire company. This includes the vision, the mission, and the goal.
Slide 27: This slide contains the information about the company aka the ‘About Us’ section. This includes the Value Clients, the Target Audience, and Preferred by Many.
Slide 28: This slide presents Our Goal- the various goals of the company.
Slide 29: This slide shows the comparison between male and female users of a product/service.
Slide 30: This Dashboard shows the low, medium, and high distribution percentage of something.
Slide 31: This slide presents the financial share of the company from minimum to maximum.
Slide 32: This slide will have a quote of your choosing.
Slide 33: This slide shows a Puzzle graphic to show how various elements of a project come together to complete it.
Slide 34: This slide shows the various targets of the company.
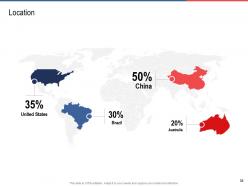
Slide 35: This slide presents the locations of the company in various countries such as the United States, Brazil, China, and Australia.
Slide 36: This slide shows a circular diagram to show the elements that make up a concept.
Slide 37: This slide provides a Venn diagram that can be used to show interconnectedness and overlap between various departments, projects, etc.
Slide 38: This slide presents a mind map to track and brainstorm ideas.
Slide 39: This slide shows the members of the company team with their name, designation, and photo represented by Silhouettes.
Slide 40: This slide presents a Magnifying Glass to give the details of the important points of a project.
Slide 41: This slide represents a Bulb or Idea. It starts from inspiration to the fully formed idea.
Slide 42: This is a Thank You slide where details such as the address, contact number, email address are added.
Cost Sheet Analysis Powerpoint Presentation Slides with all 42 slides:
Use our Cost Sheet Analysis Powerpoint Presentation Slides to effectively help you save your valuable time. They are readymade to fit into any presentation structure.


FAQs for Cost Sheet Analysis
Cost sheets break down into direct materials, direct labor, manufacturing overhead, and admin expenses - basically everything that goes into making your stuff. Prime costs are materials plus labor, conversion costs are labor plus overhead. I always mixed those up at first lol. They're super helpful because you can see exactly where money's disappearing and calculate your cost per unit. Honestly the best part is spotting which expenses are killing your profits. Track them monthly so you can compare patterns - that's when things start making sense and you can actually price smartly.
Honestly, cost sheets are game-changers. They break down exactly where your money goes - materials, labor, overhead, all of it. You'll finally see which products actually make money vs the ones just draining your account. I was shocked when I first ran mine properly! Use that data to fix your pricing or figure out what to outsource. Some product lines might be total losers you didn't even realize. Just make sure you update them regularly - old numbers will screw you over when you're trying to make real decisions.
Variance analysis is your reality check on cost sheets - it shows where actual costs went off from what you budgeted. Compare line by line to spot differences, then figure out why. Supply chain mess might've jacked up material costs. Or maybe labor came in under because your team got more efficient. Hunt down the biggest dollar variances first since those matter most. You're basically playing detective with spreadsheets (which honestly isn't as boring as it sounds). The real trick is figuring out if these variances are just random one-offs or actual patterns you need to fix going forward.
The cost sheet setup totally depends on what type of business you're running. Manufacturing? You're tracking raw materials, labor, and factory overhead through different production stages. Service companies are way different - it's mostly about labor costs, software expenses, and office overhead. I've seen both types and honestly, service sheets focus way more on billable hours and project breakdowns. Manufacturing ones track inventory moving through the system instead. Figure out what your biggest cost drivers are first - that'll tell you which direction to go. Makes the whole process way less confusing once you nail that down.
Okay so the main thing that screws people over is mixing up cost types - like putting direct labor with overhead costs. Total nightmare to untangle later. You gotta stay consistent with direct vs indirect stuff, and actually check your overhead allocation methods make sense. Hidden costs are sneaky too - utilities, depreciation, random fees you forgot about. Oh and don't use old pricing data, that'll throw everything off. Keep prime costs and conversion costs in separate buckets until you're ready to combine them properly. Honestly just make yourself a checklist and use it every single time, saves so much headache.
Look, tech is a game-changer for getting your cost sheets right. ERP systems and costing software pull live data from everywhere - material costs, labor rates, overhead stuff. No more manual calc errors driving you crazy. The variance analysis tools are honestly pretty sweet once you get the hang of them. Plus you get validation checks and audit trails, so weird numbers get flagged right away instead of showing up weeks later when you're scrambling. I'd say figure out what's breaking in your current setup first, then find software that actually fixes those specific headaches. Way better than drowning in spreadsheets forever.
So basically, cost sheets show you exactly where your money's going each quarter. I always tell people to pull their last three cost sheets first - that's where the patterns jump out at you. Material costs going up? Labor creeping higher? You'll spot it fast. Then you can actually build realistic budgets instead of just guessing. The cool part is running "what if" scenarios - like if your suppliers jack up prices 15% next quarter, you're not blindsided. It's honestly way better than flying blind with your forecasts.
Focus on cost per unit and material cost percentages first - those are your bread and butter. Labor efficiency ratios matter too, plus how you're splitting overhead costs. Gross margin is huge (honestly can't stress this enough), and contribution margin shows if you're actually profitable or just spinning your wheels. I'd also track direct vs indirect cost ratios monthly. Oh, and variance analysis comparing what you budgeted versus reality? That's where you'll catch the real money drains. Some products look good on paper but are secretly killing your margins. Start tracking these monthly and you'll spot the patterns pretty quick.
So basically, direct vs indirect classification is all about where stuff goes on your cost sheet. Direct costs like materials and labor? Easy - they go straight to specific products. Indirect costs are more annoying since they support multiple products, so you have to allocate them using predetermined rates or activity-based methods (honestly, this part can get pretty messy). Your whole cost sheet structure changes depending on this classification. Direct costs flow right into product costs. But indirect ones need that extra allocation step first. Oh, and stay consistent with your criteria across periods or you'll hate yourself later when comparing costs.
Okay so when fixed costs go up, you'll need way more sales volume just to break even - that part's pretty obvious. Variable costs are honestly the worse headache though. They hit your margins on literally every unit, which can mess with your whole pricing game. Fixed cost increases only really sting when you're selling low volumes, but variable cost bumps? They hurt no matter what. I always tell people to redo their break-even math whenever costs shift around. Also double-check how it affects your contribution margin per unit - that number tells you everything about whether you're still making decent money or not.
So you basically just pull the numbers straight from your cost sheet - that's where all your fixed costs, variable costs per unit, and selling price live anyway. Take your total fixed costs and divide by your contribution margin (which is just selling price minus variable cost per unit). That'll give you break-even in units. The math is pretty simple once you get it. Your cost sheet does most of the heavy lifting if you set it up right. Just make sure you've got your costs categorized correctly first - I learned that the hard way when my numbers were all over the place. Short sentences work. Mix it up a bit.
So traditional cost sheets just spread overhead around using basic stuff like labor hours - pretty lazy if you ask me. ABC gets into the weeds though. It tracks actual activities that eat up money, like how long setups take or how many inspections you need. Then it assigns costs based on what each product actually uses. Way more work but you'll get real numbers instead of guesswork. I've seen companies discover their "profitable" products were actually losers once they did ABC right. Total game changer for weird profit margins.
Honestly, cost sheets are like a cheat code for pricing. They show you exactly what you're spending on materials, labor, overhead - all that stuff. Once you know your real costs, you can figure out the lowest price that won't kill your margins. I actually think most people skip this step and just guess at pricing (big mistake). Pull your recent cost sheets and compare them to what you're charging now. You might find you're leaving money on the table or pricing yourself out. Either way, at least you'll know where you stand instead of flying blind.
Honestly, you're missing so much by just looking at one period at a time. When you compare cost sheets across quarters, patterns jump out - like which expenses are climbing fastest or if your operations are actually getting more efficient. It's kinda like watching a whole movie vs just one screenshot, you know? Seasonal stuff becomes obvious too. You'll catch exactly when material costs went crazy or when labor productivity improved. I'd grab your last 4-6 periods and do a basic variance analysis. Sounds boring but it really shows what's actually driving your profit changes.
So basically, cost sheet analysis shows you where every dollar's going in your business. Break it down by department or product line - it's wild how much clarity you get. Hunt for weird variances against your benchmarks and see which departments are blowing through cash faster than they should. Track this stuff monthly (or whatever works) so you know if changes actually help. Honestly, processes that look fine on paper can be profit killers. Start with your three biggest cost buckets first. Way more bang for your buck there.
-
Very unique, user-friendly presentation interface.
-
Use of different colors is good. It's simple and attractive.
-
Unique and attractive product design.
-
Great quality slides in rapid time.
-
Content of slide is easy to understand and edit.
-
Excellent template with unique design.
-
Much better than the original! Thanks for the quick turnaround.
-
Much better than the original! Thanks for the quick turnaround.
-
Wonderful templates design to use in business meetings.