


Creating the best customer experience cx strategy complete decks


Try Before you Buy Download Free Sample Product
 Impress Your
 Audience
Editable
of Time


Customer Experience CX is the interaction between a customer and the business. Customer service is just one aspect of customer experience as CX involves all interactions with a business. A great customer experience ensures brand loyalty. It results in lower churn and increased revenue. Companies are, therefore, giving importance to developing a customer experience strategy to ensure a positive and seamless experience across all touchpoints of the customer journey, be it online or offline. For businesses wishing to learn how to go about building a CX strategy or reviewing theirs, this complete deck walks you through developing the perfect customer experience strategy from scratch. This involves developing customer personas to have a better understanding of the customers needs and wants and mapping customer journey to know their thoughts, feelings and behaviour at each stage of the buying journey. The customer experience templates provided in this extensively researched deck help you list out the pain points of the customer, identify their root cause and find solutions. These steps help you in developing the CX strategy and creating a roadmap to ensure successful implementation of the project.
People who downloaded this PowerPoint presentation also viewed the following :
Content of this Powerpoint Presentation
Slide 1: This slide introduces Creating the Best Customer Experience (CX) Strategy. State your Company name and begin.
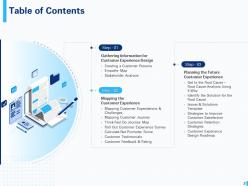
Slide 2: This slide displays Table of Contents.
Slide 3: This slide depicts Gathering Information for Customer Experience Design.
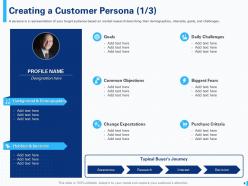
Slide 4: This slide showcases Creating a Customer Persona (1/3)
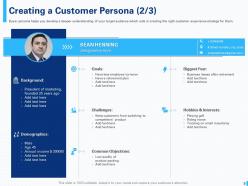
Slide 5: This slide depicts Creating a Customer Persona. Buyer persona helps you develop a deeper understanding of your target audience which aids in creating the right customer experience strategy for them.
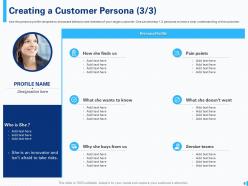
Slide 6: This slide depicts Creating a Customer Persona. Use this persona profile template to showcase behavior and interests of your target customer. One can develop 1-5 personas to have a clear understanding of the customer.
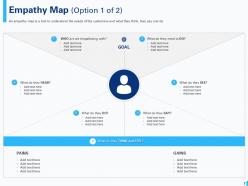
Slide 7: This slide showcases Empathy Map. An empathy map is a tool to understand the needs of the customers and what they think, feel, say and do.
Slide 8: This slide displays Empathy Map
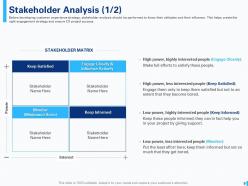
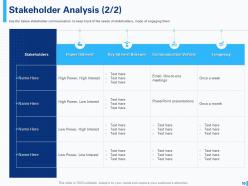
Slide 9: This slide describes Stakeholder Analysis.
Slide 10: This slide depicts Stakeholder Analysis. Use the below stakeholder communication to keep track of the needs of stakeholders, mode of engaging them
Slide 11: This slide showcases Mapping the Customer Experience.
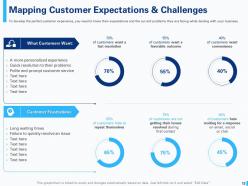
Slide 12: This slide depicts Mapping Customer Expectations & Challenges.
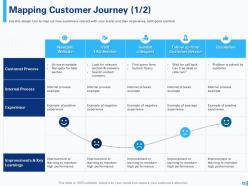
Slide 13: This slide showcases Mapping Customer Journey. Use this design tool to map out how customers interact with your brand and their experience, both good and bad.
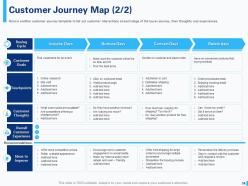
Slide 14: This slide showcases Customer Journey Map.
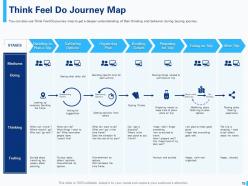
Slide 15: This slide showcases Think Feel Do Journey Map.
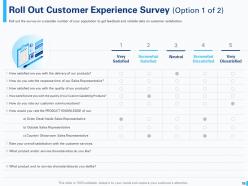
Slide 16: This slide showcases Roll Out Customer Experience Survey.
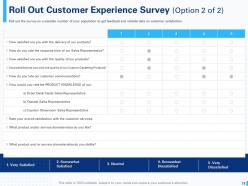
Slide 17: This slide showcases Roll Out Customer Experience Survey.
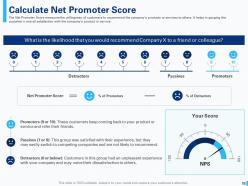
Slide 18: This slide depicts Calculate Net Promoter Score.
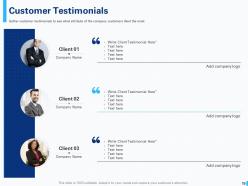
Slide 19: This slide displays Customer Testimonials.
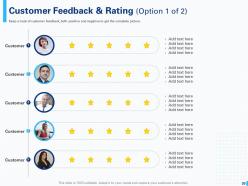
Slide 20: This slide depicts Customer Feedback & Rating.
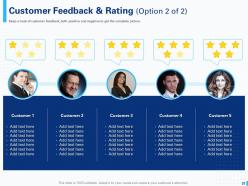
Slide 21: This slide showcases Customer Feedback & Rating. Keep a track of customer feedback, both positive and negative to get the complete picture.
Slide 22: This slide showcases Planning the Future Customer Experience.
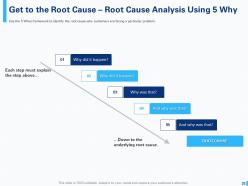
Slide 23: This slide depicts Root Cause Analysis Using 5 Why.
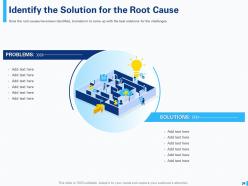
Slide 24: This slide describes Identifying the Solution for the Root Cause.
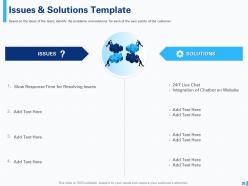
Slide 25: This slide depicts Issues & Solutions Template.
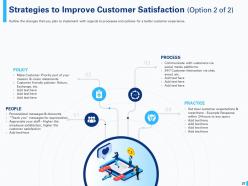
Slide 26: This slide showcases Strategies to Improve Customer Satisfaction.
Slide 27: This slide showcases Strategies to Improve Customer Satisfaction.
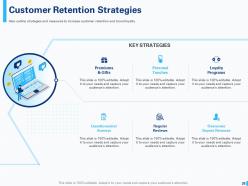
Slide 28: This slide depicts Customer Retention Strategies.
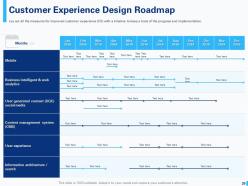
Slide 29: This slide showcases Customer Experience Design Roadmap.
Slide 30: This is Icons Slide for Creating the Best Customer Experience (CX) Strategy.
Slide 31: This slide is titled as Additional Slides for moving forward.
Slide 32: This slide displays Agenda.
Slide 33: This slide displays Company Introduction.
Slide 34: This slide showcases Our Vision Mission Values.
Slide 35: This is Our Goal slide. State your Goals here.
Slide 36: This slide displays Organization Chart
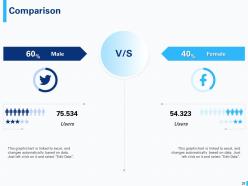
Slide 37: This is Comparison slide showcasing comparison between male users and female users.
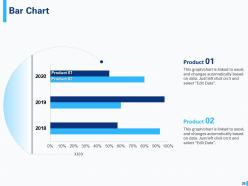
Slide 38: This slide displays Bar Chart with product comparison.
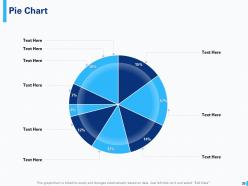
Slide 39: This slide depicts Pie Chart with product comparison.
Slide 40: This is Dashboard slide with percentages.
Slide 41: This slide displays Linear Diagram.
Slide 42: This is Circular Diagram slide with related imagery.
Slide 43: This slide displays Roadmap.
Slide 44: This slide displays Timeline process.
Slide 45: This is Thank You slide with Address, Email address and Contact number.
Creating the best customer experience cx strategy complete decks with all 45 slides:
Use our Creating The Best Customer Experience CX Strategy Complete Decks to effectively help you save your valuable time. They are readymade to fit into any presentation structure.


FAQs for Creating the best customer experience cx
Look, you'll want to nail three things: map out your customer journeys to see all the touchpoints, set up systems to track satisfaction and how people actually behave, and get your whole team aligned on the experience goals. Honestly, most teams completely bomb the mapping part because it's boring as hell but you can't skip it. Build in feedback loops too - otherwise you're just collecting data for no reason. I'd start with one main journey, do it really well, then expand. Oh and the cross-functional stuff is harder than it sounds but worth it.
Track the usual suspects first - NPS, CSAT, and Customer Effort Score give you decent baselines. But honestly? The qualitative stuff is where you'll find gold. Support tickets, feedback forms, even random Twitter complaints tell a better story sometimes. Revenue-wise, focus on retention rates and customer lifetime value - way more useful than vanity metrics. Oh, and don't try measuring everything at once (learned that the hard way). Pick maybe 4 metrics max that actually matter for your specific business. You can always add more later once you've got a system down.
Dude, your frontline people ARE your brand to customers. Engaged employees will actually solve problems and care about outcomes - you know the difference when you're dealing with someone who wants to be there vs someone who's just clocking in. Plus they stick around longer, so they know your stuff better and build real relationships. Honestly, I've seen companies totally ignore this and wonder why their customer service sucks. Regular satisfaction surveys help, and don't forget recognition programs. People want to feel valued - it's not rocket science but somehow everyone messes it up.
So basically, you want tech that actually fixes the annoying stuff your customers deal with. Chatbots are great for handling simple questions 24/7. CRM systems help too - your team won't keep asking customers to repeat their info over and over (which drives people crazy, honestly). AI can even predict what someone needs before they contact you. Mobile apps are pretty much essential now since everyone wants to solve things themselves. But here's the thing - don't just add fancy features because they look cool. Map out where customers get frustrated most and focus there first. Way more effective than throwing money at random tech.
Honestly, most companies bite off way more than they can chew right from the start. Focus on like 2-3 touchpoints max. Get your executives on board first - trust me on this one, you'll thank me later. Skip the research phase and you're basically flying blind. Actually talk to your customers instead of assuming what they want. Departments love to work in silos too, which is super frustrating. You need solid metrics to track progress, and don't forget to train your team before rolling anything out. Start small, grab some quick wins, then expand. Way less painful that way.
Honestly, most companies collect feedback but then just... sit on it. You've gotta actually close that loop. Get surveys and user interviews going at different points, but here's the thing - don't get hung up on random complaints. Look for patterns instead. I'd set up weekly team meetings to go through everything and decide what's worth fixing first. The real game-changer though? Tell people what you changed because of their input. They need to see you're listening. Just pick one annoying thing customers mentioned recently and fix it this month.
Map out who your customers actually are first - demographics, what they've bought, how they engage with you. Then customize everything based on that data. Personalized emails work great, plus product recommendations that actually make sense for each person. Landing pages too. Honestly, people get way too fancy with this stuff - sometimes just using someone's name and remembering they hate emails about shoes (if they only buy tech) does wonders. There's AI tools that'll automate most of it once you get going. Start with email though, nail that first.
So basically omnichannel support means your customers don't have to repeat their whole story every time they switch from chat to phone to email - which honestly saves everyone's sanity. The system keeps track of everything, so your support team already knows what's up when someone calls after starting a chat. People really hate explaining the same problem over and over (can't blame them). This builds way more trust since customers get consistent help no matter how they reach out. You'll see better loyalty because the experience doesn't suck across different channels. Just make sure your support tools actually talk to each other first.
Honestly, you need both the feelings stuff and the hard numbers. NPS and CSAT scores tell you if people actually like you. Then track churn rate and customer lifetime value - that's where the money shows up. Customer Effort Score is my favorite though, shows if you're making things unnecessarily complicated. First-call resolution rates matter too. Response times, obviously. Here's the thing - don't go crazy tracking like 20 different things. Pick maybe 4-5 that actually connect to what you're trying to achieve. Monthly dashboard review with the team and you're golden.
Okay so first thing - respond super fast and just own that they're pissed. Don't make excuses or get all defensive, that never works. Actually listen to what went sideways, fix it ASAP, then circle back to check they're happy. Honestly, I've watched companies flip their angriest customers into total fans doing this - it's wild how well it works. You gotta be real about the screwup though, and maybe throw in something extra to show you care. Oh and definitely track this stuff so you can catch patterns before they become bigger problems.
Amazon and Disney totally nail this stuff. Amazon's whole thing is making everything stupid easy - one-click buying, returns that don't make you want to scream. Disney obsesses over every tiny detail customers encounter. Zappos used to be the go-to example but nobody talks about them much anymore, which is weird because they're still solid. Here's the thing though - it's way bigger than just good customer service. These companies actually map out every single touchpoint and fix the annoying parts instead of just saying "sorry!" You should totally start by figuring out where your customers get pissed off in their journey with you.
Honestly, customer journey mapping is a game changer. You think you know what your customers go through, but mapping it out shows you're probably wrong about half of it. Forces you to actually walk in their shoes and spot all the annoying friction points that drive people away. Your whole team gets on the same page too, which is huge. I'd start with just one customer type - don't go crazy trying to map everyone at once. It's wild how many "obvious" problems you'll miss without doing this exercise first.
Ok so customer segmentation is basically not treating everyone the same - which honestly makes so much sense when you think about it. Your VIP customers who've bought from you for years? They need totally different messaging than someone browsing for the first time. I'd start by figuring out your top 3-4 customer types and what each group actually cares about. Then you can personalize emails, product recs, support - all of it. Without segmentation you're just hoping generic stuff works for everyone (spoiler: it doesn't). Way better to actually target people based on their behavior and needs.
Dude, happy customers are literally your best investment. They spend way more - like 67% more on average - and they're not constantly shopping around for better deals. Keeping existing customers is so much cheaper than chasing new ones too. The real magic happens when they start telling their friends about you. Word-of-mouth is basically free marketing that actually works. I'd start by mapping out where customers get frustrated in your process - those pain points are goldmines once you fix them. The whole thing compounds over time.
Honestly, you've gotta get everyone on the same page first. Document your brand voice and service stuff, then actually train people on it - I know, super fun right? But here's the thing: customers get so confused when your website sounds nothing like your phone support. Share systems between teams so they can see customer history. Maybe pick one area this week and see how badly it clashes with the others? Regular team check-ins help catch this stuff early. Short version: don't make customers feel like they're dealing with five different companies.
-
Really like the color and design of the presentation.