


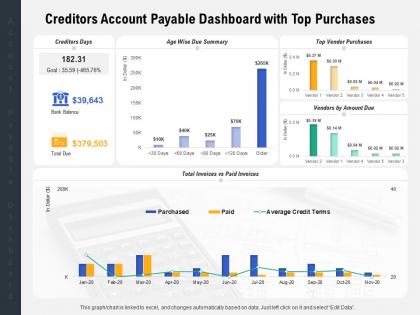
Creditors account payable dashboard with top purchases




Try Before you Buy Download Free Sample Product
 Impress Your
 Audience
 100%
100% Editable
 Save Hours
 of Time


Our Creditors Account Payable Dashboard With Top Purchases are topically designed to provide an attractive backdrop to any subject. Use them to look like a presentation pro.
People who downloaded this PowerPoint presentation also viewed the following :
Creditors account payable dashboard with top purchases with all 2 slides:
Use our Creditors Account Payable Dashboard With Top Purchases to effectively help you save your valuable time. They are readymade to fit into any presentation structure.
FAQs for Creditors account payable dashboard
So you definitely need real-time aging reports and payment tracking - that's like the bare minimum. Automated alerts for overdue stuff too, obviously. But honestly? The dashboard part is where it gets good. Find one that shows DSO trends, credit limits, and collection activity all in one place because jumping between screens will drive you insane. Customizable filters are clutch for drilling down by customer or region. Oh, and dispute management integration is super helpful. Most let you automate follow-ups too which saves tons of time. Just figure out what's annoying you most about collections right now and start there.
Honestly, a creditors dashboard is a game changer for tracking who owes you what. You'll see overdue payments instantly instead of hunting through messy spreadsheets (which is the worst). It helps you spot risky accounts early and actually plan your cash flow properly. The best part? You can prioritize collections based on real data, not just guessing who to chase first. Set up those overdue alerts right away - seriously, it'll save you so much stress. You can even use the info to negotiate better payment terms since you'll have the numbers to back you up.
Look, aging buckets are your bread and butter - track those 30/60/90+ day overdue amounts religiously. DSO trends will show you if things are getting worse. I'd definitely add payment velocity metrics because they catch problems before they blow up. Outstanding balances by customer, collection success rates, dispute volumes - all good stuff. Credit utilization ratios help too if you're setting limits. Cash flow forecasting based on expected collections is clutch. Honestly, the trick is fitting everything on one screen so you're not hunting through a million tabs every morning.
Look, real-time data integration basically makes your creditors dashboard update instantly instead of you having to refresh spreadsheets like some kind of caveman. Payment comes in? You'll see it right away. Credit scores change? Boom, it's there. Honestly, waiting for overnight batch updates is torture when you're trying to run a business. You can spot payment delays immediately and catch red flags before they turn into defaults. The key is setting up automated alerts for your important metrics - that way you're not glued to your screen 24/7 but you still know when something's off.
Look, creditors are already stressed dealing with money problems, so your dashboard can't add to that mess. Put the urgent stuff - overdue accounts, payment updates, risk flags - right up front where they'll see it immediately. Clean layout is key here. Make navigation brain-dead simple because when people are panicked about finances, they're not thinking clearly anyway. One click should get them to detailed account info. Honestly, I've seen too many dashboards that look impressive but are total nightmares to actually use. Short sentences work. If users can't find what they need fast, they'll either make bad calls or just give up on your tool completely.
Honestly, just focus on what actually matters for your specific business. Construction companies need to track retention releases and progress payments, but that's useless if you're running a retail shop, you know? Most platforms let you set up custom fields and aging buckets that make sense for your industry. I'd start by writing down your biggest 5 payment headaches first - then build everything around fixing those. Short sentences work better for dashboards anyway. Don't get caught up in fancy metrics that look cool but don't help you make real decisions about who to chase for money.
Put your most important stuff right at the top - overdue amounts, aging buckets, payment trends. That's what people actually need to see first. Colors help but don't go overboard with it (I've seen dashboards that look like someone threw up a rainbow). Simple bar charts beat those pie charts everyone loves but can't actually interpret. Group your KPIs logically and make the filters easy to find. Honestly, the best thing you can do is get real users to test it before you roll it out. They'll spot issues you'd never think of, and quick decision-making is the whole point here.
Honestly, I'd go with daily if you can swing it. Creditor stuff moves crazy fast - payments hit, disputes clear up, new debts appear out of nowhere. Weekly works too if your volume isn't insane, but anything less than that? You're gonna be working with garbage data. I've watched teams mess this up so many times by letting their dashboard get stale. Pick whatever schedule actually fits your routine and don't overthink it. Oh, and set some kind of reminder - otherwise you'll totally forget (we all do). The main thing is just being consistent about it.
Honestly, Power BI or Tableau are your best bets if you don't mind the learning curve - they're pretty powerful. Excel might sound basic but I've seen people do crazy things with pivot tables that actually look professional. Your team more on the tech side? Looker's solid, or you could go custom with Python and Plotly if you're feeling ambitious. Really depends on where your data lives and who's gonna be using this thing daily. Oh, and figure out your key metrics first - sounds obvious but you'd be surprised how many people skip that step.
Honestly, it's a game changer for avoiding those "wait, when's my car payment due again?" panic moments. You get this clear view of everything you owe and can actually plan ahead instead of constantly playing catch-up. I love being able to spot which companies might work with you on timing - some are way more flexible than others. Set up alerts for the big stuff so you're not scrambling. The best part? You can forecast your cash situation months out rather than just winging it week by week. Makes budgeting feel less like guesswork, you know?
Ask your team what decisions they actually need to make first, then work backwards from there. Focus on the stuff that matters - aging buckets, collection rates, payment trends. Don't throw every metric at them or you'll just slow everything down. Here's what drives me crazy: people making these elaborate charts when a basic table would be way clearer. Keep your data updating daily or real-time if you're actively collecting. I mean, what's the point of pretty visuals if they take forever to read? Keep it simple and actionable.
So basically you get real-time info on who's paying what and when - way better than those messy spreadsheets I used to hate dealing with. You'll spot the serial late payers right away, plus see if you're too dependent on one big client (which honestly bit me once). The best part? Set up alerts when accounts hit certain dollar amounts or days overdue. Then you can call them before things get weird instead of awkwardly chasing money later. Trust me, being proactive about this stuff saves so many headaches.
Dude, mobile access for your creditors dashboard is absolutely critical. Your team needs to check account statuses and payment histories on the go - otherwise you're missing time-sensitive collection opportunities. Touch-friendly interfaces are a must, plus fast loading times so people aren't waiting around forever (honestly, nobody has patience for slow apps anymore). When creditors can pull up risk assessments from their phones, collections move faster and customer service gets way better. You won't be stuck at your desk constantly either. Just make sure you test it on real devices first - I've seen too many dashboards that look great on desktop but are completely unusable on mobile.
So basically you connect ML models to your historical payment data and customer behavior stuff. The dashboard pulls all that to predict who's gonna be late or default - honestly the scary part is how accurate it gets at spotting trouble accounts before you do. APIs feed real-time data into algorithms trained on your portfolio. When predictions hit certain thresholds, automated alerts fire off. I'd start with simple payment timing forecasts first. Once you see how spot-on those are, then move into the heavier risk modeling. Way easier to build confidence that way.
Honestly, start with basic accounting stuff first - sounds boring but you'll be lost without it. Financial statement analysis and credit risk fundamentals are your bread and butter here. Don't make the same mistake everyone does by jumping straight into the fancy dashboard tools. Like, what's the point if you can't even read what the ratios mean? Once you get that down, practice scenario analysis with old data. Way better to mess up on historical deals than real ones, trust me. The platform-specific tutorials can come after. Get your hands dirty with portfolio monitoring techniques too - that's where you'll spend most of your time anyway.
-
Use of icon with content is very relateable, informative and appealing.
-
The Designed Graphic are very professional and classic.
-
Awesome use of colors and designs in product templates.