

 Customer Reviews
Every business involves an exchange that is rooted in trust and is aimed at building long-lasting profitable relationships. With money being at the center of every exchange, honoring financial agreements is the best way to do this. Yet, despite all your efforts at accounting for each dollar, there will be days when you will lose track of business assets and liabilities, of debit and credit. Even as this might not be deliberate, there has to be a way to put a system in place to ensure that at any point of time, your business finances are in top shape in terms of what you owe and what are owed.
To track this urgent, even non-negotiable business practice and have a clear idea of our financial obligations and liabilities is where an accounts payable dashboard steps in.
An Accounts Payable (AP) dashboard is a real-time record of your financial obligations and what your business is owed. Worked upon by an AP analyst,an AP dashboard showcases all active debts, credits, and liabilities in a specified time period. Furthermore, developing an AP dashboard gives your business the added credibility that convinces others of your sense of propriety. Maintaining a balance sheet, cash flow statement, or accounts payable KPI dashboard thus identifies your business as one that is prepared for success and knows what it looks like.
Like Idowu Koyenikan, author of Wealth for All says, “When money realizes that it is in good hands, it wants to stay and multiply in those hands.”
To help you be prepared and ready with a financial snapshot of your business at all times, we present to you our 10 editable accounts payable dashboard templates. Don’t sweat about creating accounts payable dashboard templates from scratch. Explore this ready-made variety to check mark your financial obligations by comparing invoices today.
Template 1: Account Payable Dashboard With Total Income and Expense
Create an AP dashboard that monitors the total income and expenditure of your organization for a given time period. Track result-based indices like net profit, cash at the end of month, current ratio, etc. Moreover,with this PPT Layout, you can keep an eye on the income statement as well. Grab this editable, Excel-linked PPT Template now.

Template 2: Account Payable Dashboard With Pending Invoices
If you are looking to address your payments in terms of their age, amounts payable and receivable, average time to pay, unreconciled payments, etc, use this editable framework to monitor this data. Keep your invoices handy to report and monitor blocked invoices, invoices paid after the due date, and pending invoices for which goods have been received. Use graphs and charts in this PPT Template to mark yourself as an expert and to present your meaningful insights. Download now.

Template 3: Account Payable Dashboard With Outstanding Invoices
Tally invoices and track how far behind you are in clearing your dues or collecting payments. Monitor the total invoice amount with number of invoices, outstanding invoice amount, department wise outstanding invoices, and invoices overdue. Using pie charts and graphs, represent this information effectively. Grab it now.

Template 4: Creditors Account Payable Dashboard With Top Purchases
Track invoices that your vendors have shared to know about your pending payments, and those cleared with this dashboard template. Collate annual data of your purchases and perform a monthly analysis of purchases vs paid amounts. Monitor your creditor days against target days and check the financial feasibility of businesses engaging with you with this dashboard data. Get this editable layout now.

Template 5: Finance KPI Dashboard Indicating Account Receivable and Account Payable
Keep track of your payments receivable and payable with this diagrammatic PPT Layout. Depict your annual cash flow and in light of that devise your payment timeline. Highlight the total account aging for payments due, and to be received, via designated graphs as shown here. Download now to be an expert in result-based financial analysis of businesses.

Template 6: Account Payable Performance Dashboard Analysis
How efficient is your invoice clearing performance with respect to amount payable and receivable? Use this PPT Dashboard to scrutinize it. Tally your outstanding invoices with respect to their age, department, and user status. Track how you tackled these over the months, and other relevant data with graphs and charts. You can monitor the invoice processing status with this PowerPoint Layout. Get it now.

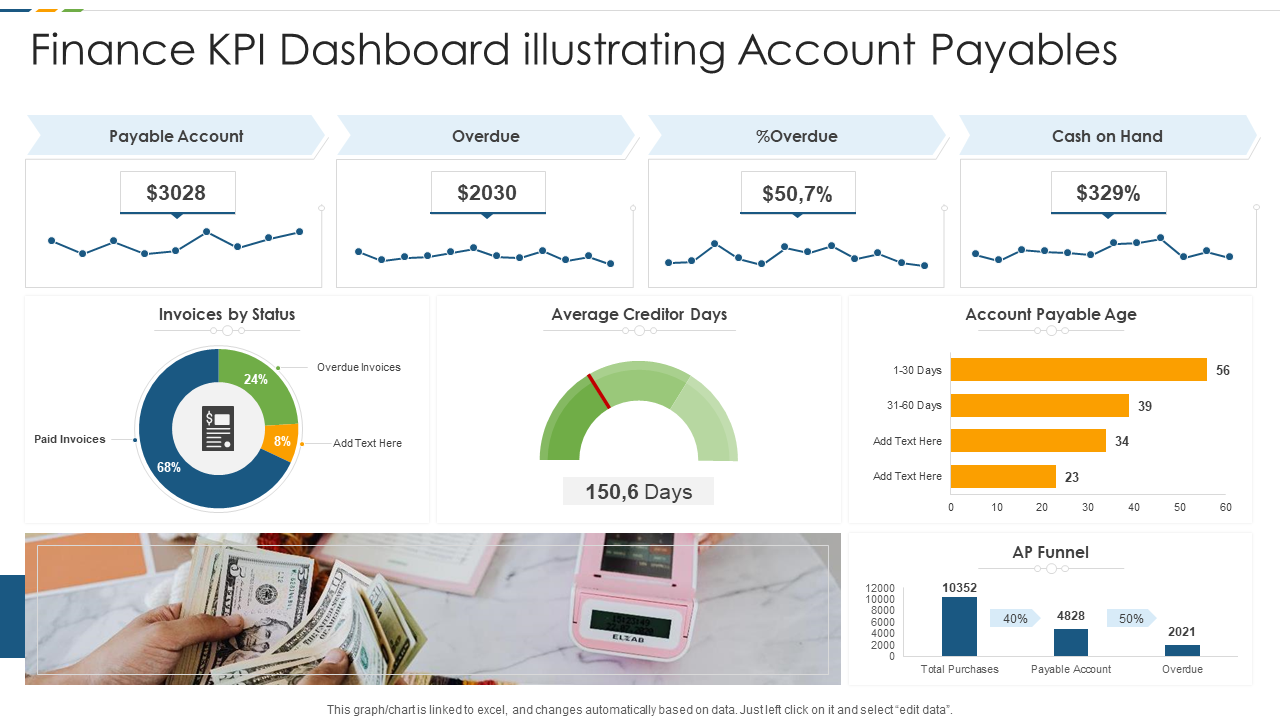
Template 7: Finance KPI Dashboard Illustrating Account Payables
As part of financial analysis, here is a template to pay heed to account payables. Use this dashboard template to monitor your indebtedness and borrowings. Track amount payables overdue, and cash in hand. Use diagrams to track average creditor days, account payable age, and create an AP funnel to analyze your financial status. Download this presentation to make sure you improve your standing as business in the shortest possible time with focus on key areas.
Template 8: Accounts Payable Dashboard on Hand PowerPoint Presentation
Create an easy to use and accessible AP dashboard with this PPT Layout. Using a mix and match of charts, graphs, and metric diagrams, monitor your payable amounts, overdues, and amount payable ages on a monthly basis. Replicate this framework for other financial months and create an annual AP report with this PPT Template. Get it now.

Template 9: Working Capital Dashboard With Accounts Receivable and Payable
Here is an all-encompassing layout to track your working capital with accounts receivable and payable. Use our specially curated diagrams, graphs, and charts to track comparison between amounts payable and receivable such as aging, overdue, clients and vendor balance. Use this editable PPT by downloading from the link below.

Template 10: Monthly Account Payable Dashboard With Overdue Amount
Here is another colorful display of graphs to track and present your account payable parameters such as balance, overdues, average due days, purchases etc. The colors reduce the complexity of information being displayed and these graphs can be repositioned as well. Download this presentation template now!

Start tracking your financial leaks and strengthen your partnerships with these accounts payable dashboard templates. Get them now.
PS: Want to learn about strategic partnerships and how to build one with your alliances? Check this guide featuring strategic partnership framework and proposal templates.
FAQs on Accounts Payable Dashboard
How to create accounts payable dashboard?
Use the following steps for an accounts payable dashboard creation:
- Identify key stakeholders and users of the dashboard. This will help you understand what information they need and how they will use the dashboard.
- Define KPIs that will be tracked on the dashboard. These should be relevant to the goals of the AP department and the needs of users. Some examples of AP KPIs include payment turnaround time, percentage of invoices paid on time, and the number of disputed invoices.
- Gather the necessary data for the dashboard. This may include information from your accounting system, vendor invoices, and other sources.
- Decide on the layout and design of the dashboard.
- Build the dashboard using a tool or platform that allows you to easily manipulate and display the data. Some options include Excel, Google Sheets, or a dedicated dashboard software like Tableau or Klipfolio.
- Test the dashboard.
- Roll out the dashboard and provide training on how to use it effectively.
- Monitor and update the dashboard on a regular basis
What are the AP dashboard’s KPIs and metrics to be tracked?
Here is a list of potential KPIs and metrics that can be tracked on an accounts payable dashboard are:
- Total accounts payable
- Current accounts payable
- Overdue accounts payable
- Open and cleared invoices
- Accounts payable aging
- Top vendors
- Accounts payable turnover
- Days payable outstanding (DPO)
- Payment turnaround time
- Percentage of invoices paid on time
- Number of disputed invoices
- Number of new vendor onboarding requests
- Number of vendor contracts up for renewal
- Average discount taken on early payment of invoices.
It's important to note that the specific KPIs and metrics that are tracked on an AP dashboard will depend on the goals of the AP department and the needs of the stakeholders.
What are the key insights of an AP dashboard?
Here are some potential insights of an Accounts Payable Dashboard (APD):
Reminders: These can alert users to time-sensitive to-do items, such as due dates, discount deadlines for payments, and open or new items that require attention.
Key performance indicators (KPIs): These can display real-time data for selected performance metrics using visualizations such as KPI meters. Users can toggle between different KPIs and view values.
Charts and graphs: These can show key trends, such as total monthly payables and spending by key vendors.
Accounts payable aging chart: This can show unpaid invoices grouped into buckets based on their due dates, providing a visual representation of the pace of cash outflows and the number of invoices that remain unpaid.
Transaction search: This can enable users to search for detailed items anywhere in the AP workflow.
Navigation shortcuts: These can provide quick access to AP reports and other resources, such as vendor lists.
Discount payment alerts: These can remind users of deadlines for capturing vendor discounts (often for early payment) to maximize savings.


![Top 10 Product Pricing Templates to Balance Affordability and Profitability [Free PDF Attached]](https://www.slideteam.net/wp/wp-content/uploads/2022/06/Top-10-Product-Pricing-Templates_1-1013x441.png)