


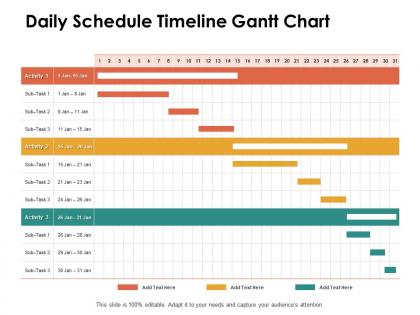
Daily schedule timeline gantt chart ppt powerpoint presentation infographics




Try Before you Buy Download Free Sample Product
 Impress Your
 Audience
 100%
100% Editable
 Save Hours
 of Time


Don the jeans with our Daily Schedule Timeline Gantt Chart Ppt Powerpoint Presentation Infographics. Feel at home in informal discussions.
People who downloaded this PowerPoint presentation also viewed the following :
Daily schedule timeline gantt chart ppt powerpoint presentation infographics with all 2 slides:
Feel at home in informal discussions with our Daily Schedule Timeline Gantt Chart Ppt Powerpoint Presentation Infographics. You can don the jeans.
FAQs for Daily schedule timeline gantt chart ppt
So Gantt charts are these horizontal bar timeline things that show when each task happens in your project. They're way better than regular to-do lists because you can actually see how tasks connect - like if one thing has to finish before another can start. Kanban boards are cool but they don't show timing like this does. Honestly, for small stuff they're probably too much work to set up. But when you've got multiple deadlines hitting at once? Total lifesaver. I started using them after a project went completely sideways last year. Trust me, try one next time things get complicated.
Figure out what you actually need to track first - dependencies? Budget? Just basic deadlines? Add custom columns for stuff your team will use (assignee, priority, whatever). Color coding is seriously underrated - I use it for different phases or departments and it makes everything way clearer. You can switch the timeline view between daily/weekly/monthly too depending on your project length. Just don't customize it to death though. If people can't figure out how to read or update it quickly, you've probably gone too far.
So you need task names, start/end dates, and those duration bars obviously. Dependencies between tasks are crucial - plus clear milestones. Here's the thing most people completely botch: they forget to assign task owners. Then they're shocked when deadlines get blown. Build in some buffer time because things always take longer than you think. Different colors help separate phases or departments, which is super helpful. Keep it simple enough that someone can look at it for like 2 seconds and get what's happening when. Honestly, start basic and add fancy stuff later if you really need it.
Honestly, Gantt charts are like having a shared brain for your team. No more awkward "uh, what's everyone working on?" meetings. They show dependencies super clearly - like when Jim's thing needs to be done before Sarah can even start hers. Timeline view is clutch for explaining to stakeholders why stuff takes actual time (you know how they are). I'd start by just sketching out your big milestones first, then fill in the connecting pieces. Makes everything click way faster than trying to keep it all in your head.
Oh man, so many good options! Microsoft Project is the gold standard but it's honestly way too much unless you're managing something huge. I'd go with Asana or Monday.com first - both have free tiers and they're actually fun to use. Smartsheet's solid too if you want something more Excel-like. Google Sheets has templates that work fine in a pinch. Even Trello added timeline views recently which is pretty neat. Honestly though? Start free with Asana and see how you like it before spending money on anything fancy.
Break your project down into smaller chunks first - way easier to estimate that way. I made this mistake on my first big project and it was a disaster lol. Talk to your teammates about how long similar stuff took them before. Dependencies between tasks will mess you up if you don't plan for them. Honestly, most people are terrible at guessing timelines. Always pad your estimates because something will definitely go sideways. Historical data helps tons if you've got it. Don't pack your schedule too tight - your team needs breathing room. Add like 15-20% buffer time minimum.
So for showing dependencies in Gantt charts, you'll want to use connecting lines between tasks - most tools call them dependency links or something like that. Color-coding helps a ton. I usually do red for critical stuff and gray for flexible dependencies. Some tools let you get crazy with different arrow styles, but honestly? That just makes everything look cluttered. Map out your critical dependencies first, then worry about the other connections later. Oh, and most software will draw these automatically once you set up the task relationships, which is pretty nice.
Honestly, just update your Gantt chart weekly with real completion percentages vs what you planned. When tasks finish, you'll see right away what's ahead or behind schedule - those filling progress bars are oddly satisfying lol. Dependencies become super obvious too, especially if early stuff is running late and might mess up later tasks. I always do updates during team meetings so nobody's confused about where we stand. Oh, and use different colors for status levels! Makes delays jump out instantly instead of having to squint at tiny percentages.
Honestly, the worst thing you can do is overcomplicate it with a million tiny tasks - nobody wants to read that mess. Most people also forget about dependencies between stuff, which totally screws up your deadlines. Oh, and not updating it regularly? I've watched so many gorgeous timelines become completely useless after like a week because people just abandon them. Always build in buffer time since everything takes way longer than you think (learned this the hard way). Focus on big milestones instead of getting lost in details. Treat it like something you'll actually reference and update, not just create once and forget about.
Yeah, totally! Gantt charts work fine in Agile - just don't get too crazy with them. I'd stick to sprint-level stuff instead of trying to plan six months out (learned that the hard way). They're actually pretty solid for showing dependencies between sprints and keeping stakeholders happy since they love those traditional timeline views. Keep yours high-level with just epics and big milestones. Your daily kanban board handles the nitty-gritty anyway. Oh, and update it after sprint reviews or it'll just collect digital dust like every other doc nobody maintains.
Dude, Gantt charts are amazing for figuring out who's doing what. You can literally see when someone's swamped vs when they're twiddling their thumbs - the visual timeline makes it super obvious. No more "wait, why does everyone need Mike on Tuesday?" disasters. I actually love using the resource view if your tool has it, makes spotting overloads way easier. You'll catch scheduling conflicts before they blow up and can shuffle things around. Only downside is setting them up initially takes forever, but totally worth it once you're rolling.
Honestly, Gantt charts are clutch for this stuff. You can drop those little diamond markers right on your timeline to mark big deliverables or decision points. The best part? You'll actually see when one delayed task is gonna mess up everything downstream - way better than finding out last minute. Stakeholders love the visual aspect too, makes updates way less painful. I usually put milestones at the end of major phases or when we need client approval on something. Oh, and don't go overboard with too many - you'll just clutter the whole thing up.
Honestly, online Gantt tools are where it's at for team stuff. Everyone sees updates instantly, which is clutch when you're all working remotely. Plus you can check things from your phone or whatever. The downside? You need decent internet. MS Project and those offline ones have more bells and whistles, but then you're back to emailing files around like it's 2010. Maybe if you're flying a lot or have terrible wifi, offline makes sense. But for most situations, I'd just go online - the real-time collaboration thing alone makes it worth it.
When your project goes off the rails (and it will), Gantt charts are actually pretty forgiving. You can drag tasks around to new dates, stretch or shrink timelines, throw in extra tasks when scope creep hits. Most software automatically shifts dependent tasks when you move stuff - seriously saves your sanity. Progress percentages and resources? Yeah, you can tweak those too as things change. The trick is updating it regularly instead of letting it turn into some fairy tale that has nothing to do with your actual project. Figure out what shifted first, then trace through how it affects everything else.
Honestly, just track the basics first - task completion percentage and how far ahead or behind schedule you are. Milestone completion rates are my go-to because they're super easy to explain when your boss asks what's happening. Critical path progress matters too, obviously. If your tool does it, keep an eye on budget burn rate and resource utilization. But seriously, don't overcomplicate this stuff - pick maybe 3 metrics that actually make sense for your project. Weekly updates work for most things, though you might need to adjust. The baseline vs actual comparison will save your butt when things start going sideways.
No Reviews