


Gantt chart for month of project planning illustrate the time schedule of tasks


Try Before you Buy Download Free Sample Product
 Impress Your
 Audience
Editable
of Time


Our Gantt Chart For Month Of Project Planning Illustrate The Time Schedule Of Tasks won't let you get behind. They ensure you continue forward.
People who downloaded this PowerPoint presentation also viewed the following :
Content of this Powerpoint Presentation
Description:
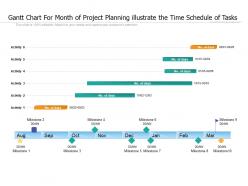
The image depicts a Gantt chart titled "Gantt Chart For Month of Project Planning illustrate the Time Schedule of Tasks." It's a visual project management tool that outlines a project schedule, indicating the duration of each activity and their respective milestones spread across a monthly timeline from August to March. The chart lists six distinct activities with corresponding time spans in days and ten milestones marked by date placeholders. This slide encourages customization to fit project specifics and is designed to focus the audience on the project timeline.
Use Cases:
This type of Gantt chart is versatile and can be utilized across multiple industries:
1. Construction:
Use: Tracking construction phases.
Presenter: Project Manager.
Audience: Construction team, investors.
2. Software Development:
Use: Scheduling software release milestones.
Presenter: Team Lead.
Audience: Developers, stakeholders.
3. Event Planning:
Use: Organizing event activities and deadlines.
Presenter: Event Coordinator.
Audience: Event staff, clients.
4. Manufacturing:
Use: Managing product development lifecycle.
Presenter: Operations Manager.
Audience: Production team, executives.
5. Education:
Use: Planning academic year and curriculum development.
Presenter: Dean or Academic Planner.
Audience: Faculty, administrative staff.
6. Marketing:
Use: Laying out campaign launch plans.
Presenter: Marketing Manager.
Audience: Marketing team, creative staff.
7. Pharmaceutical:
Use: Overseeing drug development and clinical trial phases.
Presenter: Research and Development Manager.
Audience: Research team, regulatory affairs.
Gantt chart for month of project planning illustrate the time schedule of tasks with all 2 slides:
Our Gantt Chart For Month Of Project Planning Illustrate The Time Schedule Of Tasks will definitely get behind you. They will cover your back in all circumstances.
No Reviews