

Modelo de dados Slides de apresentação do Powerpoint de TI





Try Before you Buy Download Free Sample Product
 Impress Your
Audience
 100%
Editable
 Save Hours
of Time


A modelagem de dados é o trabalho fundamental necessário para a análise de dados e permite que os dados sejam facilmente armazenados no banco de dados. Pegue nosso modelo de TI de modelo de dados criado profissionalmente. Ele fornece uma breve visão geral do modelo de dados no DBMS e fornece ferramentas conceituais para explicar a arquitetura do banco de dados em cada nível de abstração de dados. Nosso modelo de dados na plataforma do DBMS demonstra o esquema do banco de dados, ilustrando os itens do banco de dados e seus relacionamentos. Ele contém tabelas, chaves estrangeiras, chaves primárias, visualizações, colunas, tipos de dados, procedimentos armazenados, etc. Além disso, nosso PPT de técnicas de modelagem de dados inclui as diferentes etapas necessárias para criar um modelo de dados usando várias técnicas e ferramentas. Além disso, exibe as fases conceitual, lógica e física do modelo de dados, abrangendo suas características e vantagens. Por fim, nosso módulo Data Model Architecture mostra o modelo de dados específico do setor de Saúde, BFSI, Manufatura e Varejo. Baixe nosso modelo 100% editável e personalizável, também compatível com Google Slides.
People who downloaded this PowerPoint presentation also viewed the following :
Conteúdo desta apresentação em Powerpoint
Slide 1 : Este slide apresenta o Modelo de DADOS (TI). Comece informando o nome da sua empresa.
Slide 2 : Este slide descreve a Agenda da apresentação.
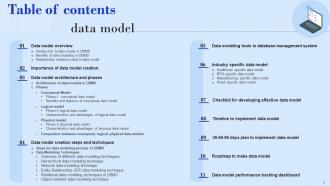
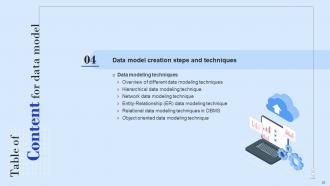
Slide 3 : Este slide incorpora o sumário.
Slide 4 : Este slide destaca o título dos tópicos a serem discutidos a seguir.
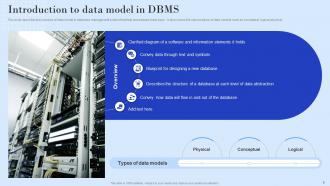
Slide 5 : Este slide descreve a visão geral do modelo de dados no sistema de gerenciamento de banco de dados que ajuda as empresas de várias maneiras.
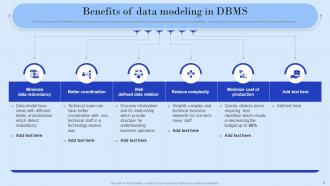
Slide 6 : Este slide aborda os benefícios da modelagem de dados, como redução da redundância de dados, coordenação aprimorada, etc.
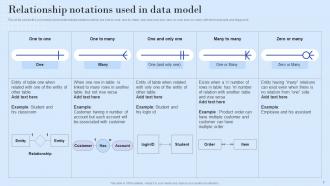
Slide 7 : Este slide mostra as notações de relacionamentos comumente usadas.
Slide 8 : Este slide inclui o título dos componentes a serem cobertos posteriormente.
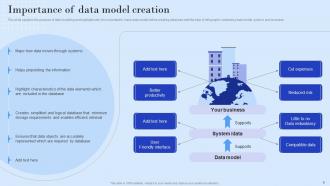
Slide 9 : Este slide explica a importância da criação do modelo de dados.
Slide 10 : Este slide revela o título das ideias a serem abordadas no modelo a seguir.
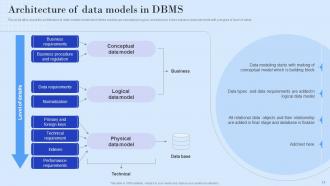
Slide 11 : Este slide fala sobre a arquitetura dos modelos de dados dentro dos quais três modelos são conceitual, lógico e físico.
Slide 12 : Este slide exibe o título das ideias a serem discutidas a seguir.
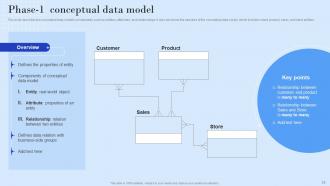
Slide 13 : Este slide descreve os componentes do modelo de dados conceituais, como entidades, atributos, etc.
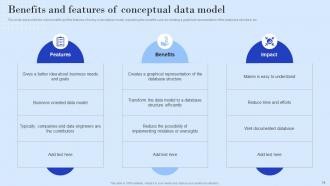
Slide 14 : Este slide representa os principais benefícios e as características do uso de um modelo conceitual.
Slide 15 : Este slide menciona o título dos tópicos a serem abordados posteriormente.
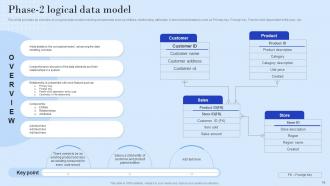
Slide 16 : Este slide fornece uma visão geral de um modelo de dados lógicos.
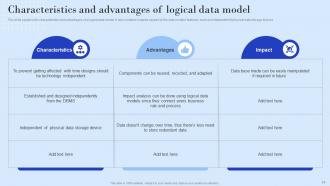
Slide 17 : Este slide explica as características e vantagens de um modelo de dados lógico.
Slide 18 : Este slide elucida o Título para o Conteúdo a ser discutido no próximo modelo.
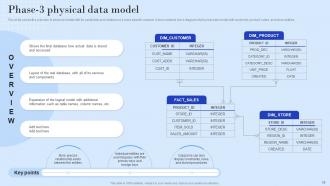
Slide 19 : Este slide mostra a visão geral do modelo físico com sua cardinalidade e relações de maneira mais específica.
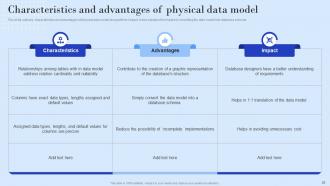
Slide 20 : Este slide descreve as características e vantagens do modelo de dados físico junto com seu impacto.
Slide 21 : Este slide indica o título das ideias a serem abordadas posteriormente.
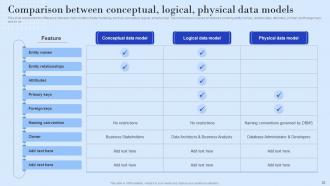
Slide 22 : Este slide representa a diferença entre os principais modelos de modelagem de dados.
Slide 23 : Este slide retrata o Título das Ideias a serem discutidas no modelo a seguir.
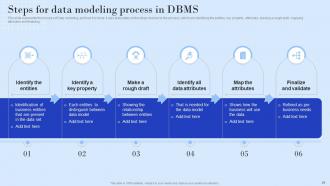
Slide 24 : Este slide descreve o processo de modelagem de dados e como isso é feito.
Slide 25 : Este slide mostra o título do conteúdo a ser abordado posteriormente.
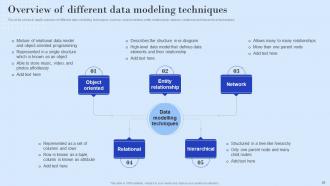
Slide 26 : Este slide mostra uma visão geral detalhada de diferentes técnicas de modelagem de dados.
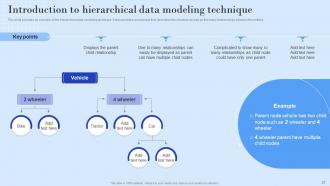
Slide 27 : Este slide fornece uma visão geral da técnica de modelagem de dados hierárquicos.
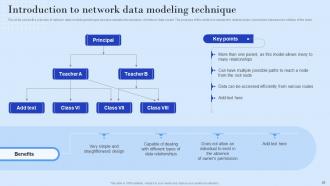
Slide 28 : Este slide mostra a visão geral da técnica de modelagem de dados de rede e também explica a estrutura do modelo de dados de rede.
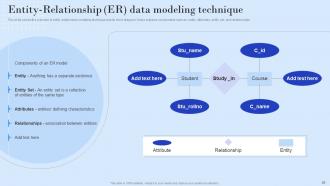
Slide 29 : Este slide apresenta a visão geral da técnica de modelagem de entidade e relacionamento e seu diagrama de blocos.
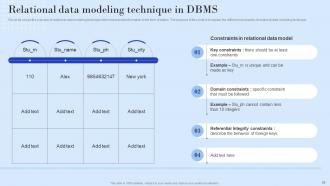
Slide 30 : Este slide descreve a técnica de modelagem de dados relacionais em DBMS.
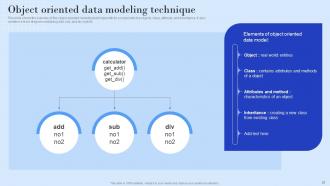
Slide 31 : Este slide exibe a visão geral da técnica de modelagem orientada a objetos com seus componentes.
Slide 32 : Este slide revela o título dos tópicos a serem discutidos a seguir.
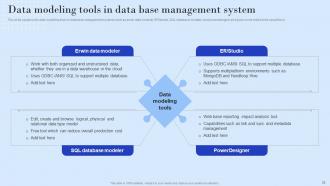
Slide 33 : Este slide explica as ferramentas de modelagem de dados em sistemas de gerenciamento de banco de dados.
Slide 34 : Este slide retrata o título das ideias a serem abordadas posteriormente.
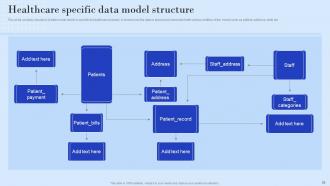
Slide 35 : Este slide contém a estrutura do modelo de dados que é específico para o setor de saúde.
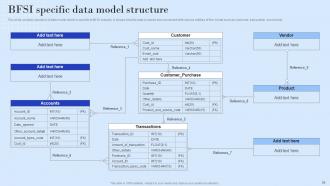
Slide 36 : Este slide trata da estrutura do modelo de dados específico do BFSI.
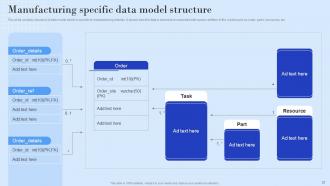
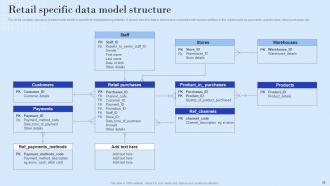
Slide 37 : Este slide inclui a estrutura do modelo de dados que é específico para a indústria de manufatura.
Slide 38 : Este slide mostra a estrutura do modelo de dados que é específico para a indústria de manufatura.
Slide 39 : Este slide exibe o título das ideias a serem discutidas no próximo modelo.
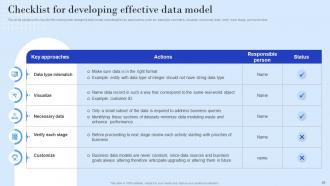
Slide 40 : Este slide explica a lista de verificação para criar um modelo de dados bem projetado.
Slide 41 : Este slide exibe o título dos tópicos a serem abordados posteriormente.
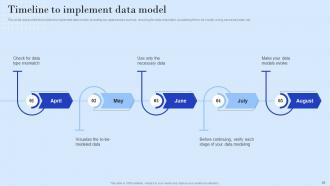
Slide 42 : Este slide representa a linha do tempo para implementar o modelo de dados.
Slide 43 : Este slide elucida o Título dos Componentes a serem discutidos no modelo a seguir.
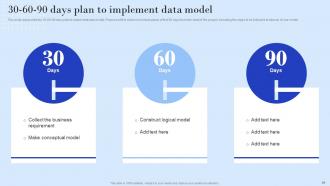
Slide 44 : Este slide representa o plano de 30-60-90 dias para implementar o modelo de dados.
Slide 45 : Este slide revela o título das ideias a serem abordadas posteriormente.
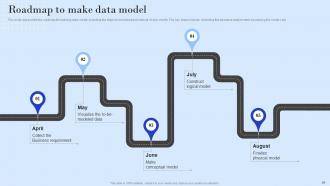
Slide 46 : Este slide representa o roteiro para a construção do modelo de dados.
Slide 47 : Este slide mostra o título das ideias a serem abordadas no modelo a seguir.
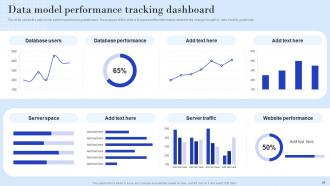
Slide 48 : Este slide mostra o painel de controle de desempenho do modelo de dados.
Slide 49 : Este é o slide dos Ícones contendo todos os Ícones usados no plano.
Slide 50 : Este slide mostra algumas informações adicionais.
Slide 51 : Este slide elucida a missão, visão e objetivo da organização.
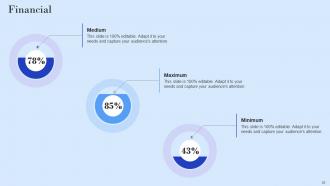
Slide 52 : Este slide apresenta informações relacionadas ao tópico Financeiro.
Slide 53 : Este é o slide do diagrama de Venn com imagens relacionadas.
Slide 54 : Este é o slide de geração de ideias para incentivar ideias inovadoras.
Slide 55 : Este slide exibe a análise SWOT.
Slide 56 : Este é o slide Conheça nossa equipe. Indique as informações relacionadas à sua equipe aqui.
Slide 57 : Este é o slide do quebra-cabeça com imagens relacionadas.
Slide 58 : Este é o slide de agradecimento pelo reconhecimento.
Slides de apresentação do PowerPoint de modelo de dados com todos os 63 slides:
Use nossos slides de apresentação do PowerPoint de modelo de dados para ajudá-lo a economizar seu valioso tempo. Eles estão prontos para caber em qualquer estrutura de apresentação.








FAQs for Data Model IT
So you'll need entities (basically your main data objects), attributes (what describes them), relationships (how they connect), and constraints (rules that keep everything working right). I always think of it like puzzle pieces - entities are the pieces themselves, attributes are their details, relationships show how they fit together. Oh and definitely use consistent naming conventions or you'll hate yourself later. Start with your core business stuff first, then figure out how it all connects. Proper normalization helps avoid storing the same data twice, which gets messy fast.
So normalization is basically splitting up your database into smaller tables instead of cramming everything into one giant mess. Gets rid of all that duplicate data that makes your life hell later. Picture organizing your closet - shoes go with shoes, shirts with shirts, you know? Same concept here. Yeah you'll have more tables to deal with, and your queries get trickier since you need joins. But honestly it's worth it because your data stays way cleaner. I'd shoot for 3rd normal form - that hits the sweet spot for most projects without going overboard.
So basically, conceptual is your big picture view - just the main stuff and how it connects, no tech details. Logical digs deeper with actual attributes and data types, but you're not tied to any specific database yet. Physical is where you get into the weeds with real table names, indexes, all that fun stuff. I always think of it like planning a trip - conceptual is "let's go to Europe," logical is your actual itinerary, and physical is booking flights and hotels. Start high level when you're gathering requirements, then work your way down. Makes way more sense that way.
Your data model is literally the foundation for everything performance-wise. Good normalization cuts out redundant data, and proper indexing gives you those clean access paths you need. Honestly, thinking through your query patterns before you build anything saves so much headache later - I learned this the hard way on my last project. Short story: well-designed table relationships mean way fewer expensive joins down the road. Map out your most common queries first, then build your tables around how you'll actually access the data. Trust me, you'll thank yourself later when everything just runs smoothly.
Documentation will save your sanity, seriously. I learned this the hard way when I inherited a model with zero notes - spent weeks deciphering random field names and weird relationships. You'll want to document entity connections, business rules, and any weird assumptions you made. Data lineage is huge too. The trick is doing it as you build, not after (because let's be real, you'll never go back and do it later). Your future self will actually love you for it. Oh, and your coworkers won't hate you when they have to touch your work.
Dude, definitely treat your data models like they're alive - they need regular checkups. I do quarterly reviews, sometimes twice a year if things are crazy. Check if they still match what's actually happening in your business. Get feedback from the people using it daily, not just your data team (they miss the obvious stuff sometimes). Oh and document everything when you change it - future you will thank you. The worst thing is waiting until something totally breaks to realize your model's been garbage for months. Stay ahead of it instead of playing catch-up later.
Don't get too crazy with normalization - I see people split everything into tiny tables and it gets messy fast. Same goes the other way though, cramming everything together is just as bad. Pick consistent naming from day one because cleaning that up later is honestly the worst. Performance stuff bites people all the time too. Your design looks perfect until you throw real data at it and everything crawls. Start simple, pick your naming rules early, then test it with actual queries you'd run. I always mock up fake data first - saves so much headache later when you realize something doesn't work.
Dude, relationships are literally what hold your whole data model together. They dictate table structure, keys, everything. For one-to-many, you'll stick foreign keys in the "many" table. Many-to-many? That's where junction tables come in - and yeah, those get annoying real quick. I always map out the main entities first, then figure out how they connect naturally. Don't dive into technical stuff right away. Trust me, changing relationship structures later is such a headache. The whole thing affects normalization and query speed too, so getting it right upfront saves you tons of grief.
So cardinality is basically how many records in one table can connect to another table. You've got one-to-one, one-to-many, or many-to-many relationships. Honestly, I learned this the hard way - screwed up a project once by modeling everything as many-to-many when most were just one-to-many. What a mess that was! It affects your whole database structure, from foreign keys to how you write queries. My advice? Sketch out the real-world relationships first before you even touch the database. Trust me, fixing cardinality issues later is way more painful than getting it right upfront.
Honestly, visualization tools are a game changer for understanding data models. You know how staring at spreadsheets makes your eyes glaze over? Well, diagrams actually show you how everything connects - like having a map instead of just directions written on a napkin. I always start with basic entity-relationship diagrams since they're pretty straightforward. Visual formats help you catch weird inconsistencies and missing links that you'd totally miss otherwise. Plus you can spot bottlenecks way faster. It's so much better than trying to decode endless text descriptions - trust me on this one.
Honestly, build security right into your data model from the start - way easier than trying to fix it later. Access controls are huge - figure out who sees what data and how granular you want to get. Encrypt anything sensitive like PII or financial stuff, obviously. Oh, and set up data lineage tracking now. Sounds boring but you'll love having those audit trails when compliance season hits. Data masking for your test environments is smart too. I'd start by just categorizing your data by sensitivity level - that makes all the other decisions way clearer.
Dude, you've gotta build in flexibility right from the start because business requirements will 100% change on you. Trust me on this one - I got burned last year thinking I could just design for current needs. Normalize your core stuff but leave wiggle room with extensible attributes or JSON fields for whatever weird data they throw at you later. Oh, and definitely version your schema changes early. Honestly, the whole "plan for what we need now" approach is basically setting yourself up for a nightmare rebuild. Just assume everything will change because... yeah, it always does.
Dude, cloud computing basically flipped data modeling on its head. Instead of those old rigid systems, you're designing for crazy scale and flexibility now. Resources spin up whenever you need them, so your models have to handle wild workload swings across different regions. Microservices are huge in cloud platforms too - you'll end up chopping those massive monolithic models into smaller pieces for each service. Honestly felt like drinking from a fire hose when I first started! The biggest mindset shift? Think API-first and build everything cloud-native from day one. Don't try retrofitting old stuff.
Yeah totally - just chunk your data models into smaller pieces instead of designing the whole thing upfront. Focus on your core entities first, the stuff that actually supports what the business needs right now. Then build it out sprint by sprint based on feedback. Honestly, I've watched so many teams get completely paralyzed trying to model everything perfectly from the start (such a waste of time). Work with stakeholders in short cycles, test your assumptions early, and don't be afraid to refactor when things change. Your data model should grow as you understand the business better - it's never really "done" anyway.
Honestly, just nail down your naming conventions from day one - you'll hate yourself later trying to figure out what "tbl_usr_v2_final" means. Get everyone using version control for schema changes, and don't be that person who drops a table without warning the team first. Having other people review your designs is huge because you get tunnel vision with your own work. Oh, and create some kind of shared dictionary for business terms since marketing calls it "leads" but sales calls them "prospects" or whatever. The domain experts know way more than they let on, so loop them in early. Saves tons of headaches.
-
Understandable and informative presentation.
-
Design layout is very impressive.