


Data Structure In DBMS Powerpoint Presentation Slides




Try Before you Buy Download Free Sample Product
 Impress Your
 Audience
 100%
100% Editable
 Save Hours
 of Time


Data modeling is the core foundational work needed for data analytics and enables data to be easily stored in the database. Grab our professionally crafted Data Structure in DBMS template. It gives a brief overview of the data model in DBMS and provides conceptual tools for explaining database architecture at each level of data abstraction. Our Data Model in the DBMS deck demonstrates the database schema, illustrating the database items and their relationships. It contains tables, foreign keys, primary keys, views, columns, data types, stored procedures, etc. In addition, our Data Modeling Techniques PPT includes the different steps required for creating a data model using various techniques and tools. Further, it exhibits the conceptual, logical, and physical data model phases covering its characteristics and advantages. Lastly, our Data Model Architecture module showcases the Industry-specific data model of Healthcare, BFSI, Manufacturing, and Retail. Download our 100 percent editable and customizable template, also compatible with Google Slides.
People who downloaded this PowerPoint presentation also viewed the following :
Content of this Powerpoint Presentation
Slide 1: This slide introduces Data Structure in DBMS. Commence by stating Your Company Name.
Slide 2: This slide depicts the Agenda of the presentation.
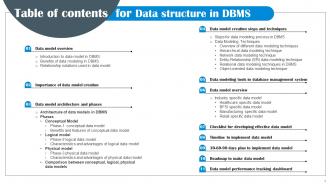
Slide 3: This slide incorporates the Table of contents.
Slide 4: This slide highlights the Title for the Topics to be discussed next.
Slide 5: This slide describes the overview of data model in database management system that help businesses many ways.
Slide 6: This slide covers the benefits of data modeling such as reducing data redundancy, improved coordination, etc.
Slide 7: This slide shows the commonly used relationships notations.
Slide 8: This slide includes the Heading for the Components to be covered further.
Slide 9: This slide explains the Importance of data model creation.
Slide 10: This slide reveals the Title for the Ideas to be covered in the following template.
Slide 11: This slide talks about the architecture of data models inside which three models are conceptual, logical, and physical.
Slide 12: This slide displays the Heading for the Ideas to be discussed next.
Slide 13: This slide describes the conceptual data model's components, such as entities, attributes, etc.
Slide 14: This slide represents the main benefits and the features of using a conceptual model.
Slide 15: This slide mentions the Title for the Topics to be covered further.
Slide 16: This slide provides an overview of a logical data model.
Slide 17: This slide explains the characteristics and advantages of a logical data model.
Slide 18: This slide elucidates the Heading for the Contents to be discussed in the next template.
Slide 19: This slide shows the overview of physical model with its cardinality and relations in a more specific manner.
Slide 20: This slide outlines the characteristics and advantages of physical data model along with its impact.
Slide 21: This slide indicates the Title for the Ideas to be covered further.
Slide 22: This slide represents the difference between main models of data modeling.
Slide 23: This slide portrays the Heading for the Ideas to be discussed in the following template.
Slide 24: This slide states the process of Data modeling, and how it is done.
Slide 25: This slide shows the Title for the Contents to be covered further.
Slide 26: This slide shows in depth overview of different data modeling techniques.
Slide 27: This slide provides an overview of the hierarchical data modeling technique.
Slide 28: This slide shows the overview of network data modeling technique and also explains the structure of network data model.
Slide 29: This slide presents the overview of entity relationship modeling technique and its block diagram.
Slide 30: This slide depicts the Relational data modeling technique in DBMS.
Slide 31: This slide exhibits the overview of the object-oriented modeling technique with its components.
Slide 32: This slide reveals the Heading for the Topics to be discussed next.
Slide 33: This slide explains the data modeling tools in database management systems.
Slide 34: This slide portrays the Title for the Ideas to be covered further.
Slide 35: This slide contains structure of data model which is specific to healthcare industry.
Slide 36: This slide deals with the BFSI specific data model structure.
Slide 37: This slide includes the structure of data model which is specific to manufacturing industry.
Slide 38: This slide showcases the structure of data model which is specific to manufacturing industry.
Slide 39: This slide displays the Heading for the Ideas to be discussed in the forth-coming template.
Slide 40: This slide explains the checklist for making well-designed data model.
Slide 41: This slide exhibits the Title for the Topics to be covered further.
Slide 42: This slide represents the timeline to implement data model.
Slide 43: This slide elucidates the Heading for the Components to be discussed in the following template.
Slide 44: This slide represents the 30-60-90 days plan to implement data model.
Slide 45: This slide reveals the Title for the Ideas to be covered further.
Slide 46: This slide represents the roadmap for building data model.
Slide 47: This slide showcases the Heading for the Ideas to be covered in the following template.
Slide 48: This slide shows the data model performance tracking dashboard.
Slide 49: This is the Icons slide containing all the Icons used in the plan.
Slide 50: This slide depicts some Additional information.
Slide 51: This slide elucidates the mission, vision, and goal of the organization.
Slide 52: This slide showcases information related to the Financial topic.
Slide 53: This is the Venn diagram slide with related imagery.
Slide 54: This is the Idea generation slide for encouraging innovative ideas.
Slide 55: This slide displays the SWOT analysis.
Slide 56: This is Meet our team slide. State your team-related information here.
Slide 57: This is the Puzzle slide with related imagery.
Slide 58: This is the Thank You slide for acknowledgement.
Data Structure In DBMS Powerpoint Presentation Slides with all 66 slides:
Use our Data Structure In DBMS Powerpoint Presentation Slides to effectively help you save your valuable time. They are readymade to fit into any presentation structure.













FAQs for Data Structure In DBMS
Hierarchical databases organize stuff in a strict tree - parent to child, top to bottom. You can't really jump around, which gets annoying fast. Relational databases use tables that connect through keys instead. Way more flexible since you can query across multiple tables however you want. Most old systems like IBM's IMS used hierarchical, but honestly? Relational dominates now for good reason. MySQL, PostgreSQL - they handle complex queries and relationships so much better. I'd say go relational unless you're dealing with something that's literally tree-structured. The flexibility is worth it.
So indexes are like shortcuts for your database - instead of checking every single row, it jumps straight to what you need. Kind of like how you'd use a book's index to find "optimization" on page 247 rather than flipping through everything. The database builds these separate tree structures that map your columns to where the actual data lives. Turns slow table scans into quick lookups. One thing though - they'll speed up your reads but writes get a bit slower since the index has to update too. I usually just focus on indexing the columns I query most often. Works pretty well.
So normalization is just splitting up your database tables to avoid duplicate info. You're storing each piece of data once instead of having the same customer address scattered everywhere - which honestly gets messy fast. Foreign keys keep everything connected properly and stop you from having random orphaned records floating around. I know it seems like extra work upfront, but trust me, it saves tons of headaches later. Most projects do fine with 3NF - catches like 90% of redundancy problems without making things overly complicated. Way better than dealing with inconsistent data down the road.
So B-trees are these self-balancing search trees that keep everything sorted - super useful for databases. Picture a filing cabinet where each drawer holds multiple files and reorganizes itself when it gets crowded. All the bottom levels stay even, so your search times don't get weird as you add more data. Most databases actually use B+ trees (slight variation) for their indexes since they're amazing at range queries. Oh and they handle frequent changes really well too - like if you're constantly adding/removing records. They're honestly perfect for fast lookups when your data keeps changing.
Think of foreign keys as the glue holding your database together. You've got a Customers table and an Orders table, right? Well, the customer_id in Orders points back to your Customers table - that's your foreign key. Pretty straightforward stuff. It stops you from creating orders for customers who don't actually exist, which honestly saves you from some real headaches later. I learned this the hard way on my first project. Your data stays clean and nothing gets orphaned. Set up those constraints from the start - trust me on this one.
So basically NoSQL ditches those rigid table setups you know from SQL. You can store JSON docs, weird nested stuff, whatever your app needs - no predefined schema required. MongoDB's probably your best bet to start with, or Redis if you want something simpler. Yeah, you lose some of that strict consistency (which honestly isn't always a bad thing), but the flexibility is pretty sweet. Your data doesn't have to squeeze into perfect little boxes anymore. Plus it scales way better when you're dealing with tons of traffic.
Honestly, indexes are gonna be your lifesaver here - put them on anything you're constantly searching or joining. Don't do SELECT * (I'm guilty of this too sometimes), write decent WHERE clauses, and make your joins actually efficient. Check those execution plans religiously - they'll show you what's really going wrong. For huge tables, partitioning helps a ton. Update your table statistics regularly. Sometimes you might need to denormalize stuff if you're doing tons of reads. Start by finding your slowest queries with profiling tools, then fix the worst ones first.
Here's the thing - data structures literally make or break your database's ability to scale. B-trees for indexing? Hash tables for lookups? That stuff keeps queries fast when your data gets huge. Pick crappy structures though and you'll slam into performance walls. Kind of like... okay bad analogy but it's like building a house on sand, you know? The big ones to think about are your indexing methods, how you're storing everything, and query optimization trees. My advice? Don't cheap out on this upfront design work. Way easier than trying to fix it later when you've got millions of records.
ACID properties are the four things that keep databases from completely falling apart. Atomicity means transactions either work completely or fail completely - no half-finished messes. Consistency keeps your data valid according to rules you set. Isolation stops different users from screwing up each other's work when they're using the database simultaneously. Durability makes sure your committed changes stick around even if the server crashes (which honestly happens more than you'd think). Without these four safeguards, you'd end up with corrupted records and angry users. Definitely check how well any database handles ACID before picking one.
So denormalization actually helps when you've got tons of read queries or complex stuff pulling from multiple tables. Basically you're storing duplicate data on purpose to avoid those slow JOIN operations. I know, it sounds backwards after all that "normalize everything" stuff we learned, but sometimes speed wins over perfect design. Data warehouses do this all the time - they care way more about fast reads than saving storage space. The downside? You're giving up some data consistency and using more storage, but if your app is mostly reads then it's probably worth it.
Honestly, graph databases are perfect when your data has tons of connections. Relational databases make you do these crazy complex JOINs that just kill performance. But graph databases? They treat relationships like actual data, so finding "friends of friends" is super fast. Your data model can change without those awful schema migrations too. I've seen them work great for social networks, fraud detection, even knowledge bases. Oh and Neo4j is pretty solid if you're looking at options. Bottom line - if you're analyzing how things connect to each other, graphs beat traditional databases every time.
So warehousing is basically the opposite of what you're doing now. Instead of those tight normalized tables, you'll build these fat denormalized ones - star and snowflake schemas where everything's spread out. Fact tables in the center, dimension tables around them. Yeah it's redundant as hell, but queries fly. OLAP cubes let you slice data across time and business stuff really fast. The whole philosophy flips from "save disk space" to "save query time." Your ETL will flatten all that normalized source data into these chunky analytical structures. Takes some getting used to, honestly.
Your data structure choice makes or breaks transaction performance, honestly. B+ trees rock for range queries and stay solid under heavy writes. Hash indexes? Super fast lookups but they'll crawl during table scans. LSM trees are write-heavy champions though reads take a hit. Here's the thing - your structure also dictates how locks and isolation work. Some just handle concurrent access way better than others. I'd say pick based on what you're actually doing, not some benchmark you saw online. Don't get caught up in theoretical stuff when real workload patterns matter more.
Good data structure is honestly a game-changer for analytics. Your queries will fly when you've got indexed columns and partitioned tables set up right. I learned this the hard way after staring at loading screens for ages. Normalized relationships make everything more flexible too - you can slice your data however you want without breaking stuff. The trick is designing your schema around how you'll actually query it, not just dumping everything wherever. Nobody's got time for dashboards that take forever to load. Oh, and consistent reporting becomes way easier when your data follows logical patterns.
Focus on indexing the columns you actually query - B-tree for ranges, hash for exact matches. Normalize your schema but don't get crazy with it. Sometimes a bit of denormation actually helps performance, which is kinda counterintuitive but whatever. Pick data types that fit your real data size - why use VARCHAR(255) when you only need 20 chars? For huge tables, partition by date or logical chunks. Here's the thing though - your actual query patterns trump textbook theory every time. Figure out which queries run most often first. Then build your indexes and structure around those specific patterns instead of guessing what might work.
-
Very unique, user-friendly presentation interface.
-
Topic best represented with attractive design.