


Data transformation powerpoint presentation slides





Try Before you Buy Download Free Sample Product
 Impress Your
 Audience
 100%
100% Editable
 Save Hours
 of Time


Explore our Data Transformation PowerPoint Presentation Slides to display the steps of information migration. Demonstrate data migration approach using this data transfer PPT visuals. The content ready information transfer complete presentation has a set of slides such as data migration approach, data migration steps, data migration lifecycle, data migration process, etc. Showcase migration approach, data analysis, migration design, migration execution, and migration testing with readymade data migration plan Presentation design. Furthermore, system migration PPT visual can also be used for related topics like data conversion, data curation, data preservation, data transformation to name a few. These PPT visuals are designed by our expert designers. Besides this, all the slides given in this PowerPoint presentation are fully editable. The PowerPoint templates can be customized as per requirements of business, education or any other theme. Impress your audience with high quality visually appealing data transfer PowerPoint templates.
People who downloaded this PowerPoint presentation also viewed the following :
Content of this Powerpoint Presentation
Slide 1: This slide introduces Data Transformation. State Your Company Name and begin.
Slide 2: This is an Agenda slide. State your agendas here.
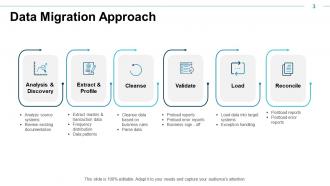
Slide 3: This slide shows Data Migration Approach describing- Analysis & Discovery, Cleanse, Load, Extract & Profile, Validate and Reconcile.
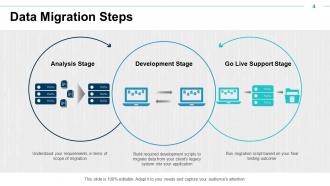
Slide 4: This slide presents Data Migration Steps which includes- Analysis Stage, Development Stage and Go Live Support Stage.
Slide 5: This slide displays Simplified Illustration of Data Migration Steps which includes- Merge, Process, Update and Deploy.
Slide 6: This slide represents Data Migration PowerPoint Template describing- Migration Approach, Data Analysis, Migration Design, Migration Execution, Migration Testing and Convert into Production.
Slide 7: This slide showcases Data Migration Life Cycle describing- Source of Document, Design Targets, Flow of Design, Execute Migration and Performance Test.
Slide 8: This slide shows Data Migration Four Step Process as- Extract, Transform, Load and Validate.
Slide 9: This slide presents Data Migration Process as- Assess, Plan, Extract, Cleanse, Load and Verify.
Slide 10: This slide displays Data Migration on Cloud as- Create a Request, Prepare & Ship, Receive & Connect, Ingest & Return, Offload & Access, Erase Device.
Slide 11: This slide represents Data Migration Step by Step Process as- Initial Data Extract from Legacy System, Data Mapping & Normalization, Conduct Test Migration, Validate & Adjust, Go - Live, Final Data validation, Load to Destination and Final Data Extract from Legacy System.
Slide 12: This slide showcases Data Migration Flowchart Template describing- Migration Plan, Gather Requirements, Data Identification, Cleansing Data, Transaction Data “Dynamic Data”, Master Data “Static Data”, Data Configuration, Coding Structure and Sub – Master Data.
Slide 13: This slide reminds about 15 minutes tea break.
Slide 14: This slide displays Data Migration Icons.
Slide 15: This slide is titled as Additional Slides for moving forward.
Slide 16: This is Meet Our Team slide with names and designation.
Slide 17: This is About Us slide to show company specifications etc.
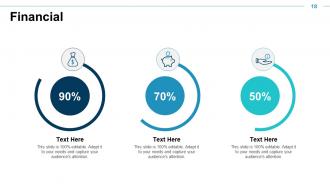
Slide 18: This is a Financial slide. Show your finance related stuff here.
Slide 19: This is a Puzzle slide with text boxes.
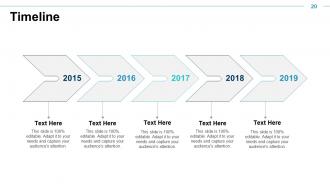
Slide 20: This is a Timeline slide. Show information related with time period here.
Slide 21: This is a Bulb or Idea slide to state a new idea or highlight information, specifications etc.
Slide 22: This slide shows Post it Notes. Post your important notes here.
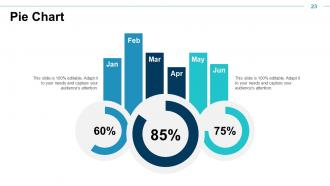
Slide 23: This slide displays Pie Chart with data in percentage.
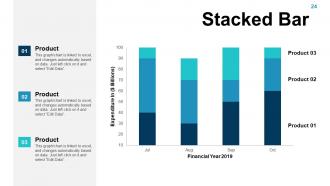
Slide 24: This slide presents Stacked Bar with three products comparison.
Slide 25: This slide represents Area Chart with three products comparison.
Slide 26: This slide showcases Column Chart with additional text boxes to show information.
Slide 27: This slide shows Clustered Bar Chart. You can add or edit data as per requirements.
Slide 28: This is a Thank you slide with address, contact numbers and email address.
Data transformation powerpoint presentation slides with all 28 slides:
Our Data Transformation Powerpoint Presentation Slides have drained the cloud. They have acquired the best collection.
-
Data Transformation
-

Our Agenda
-
Data Migration Approach
-
Data Migration Steps
-
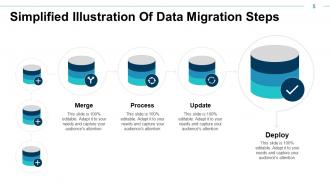
Simplified Illustration Of Data Migration Steps
-
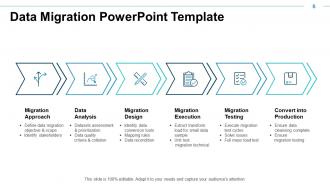
Data Migration PowerPoint Template
-
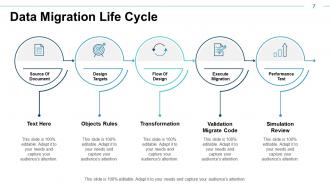
Data Migration Life Cycle
-
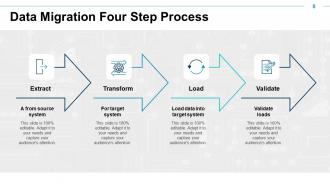
Data Migration Four Step Process
-
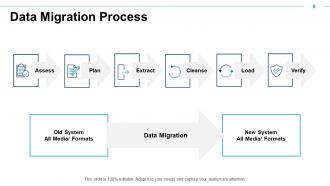
Data Migration Process
-
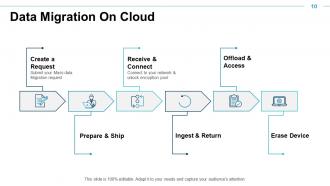
Data Migration On Cloud
-
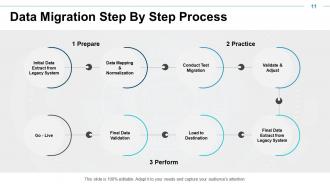
Data Migration Step By Step Process
-
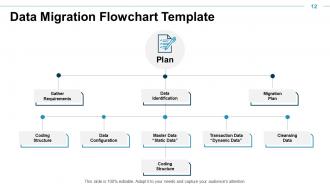
Data Migration Flowchart Template
-

Let s Have Tea Break
-
Data Migration Icon Slide
-

Additional Slides
-

Meet Our Team
-

About Us
-
Financial
-
Puzzle
-
Timeline
-
Bulb or Idea
-
Post it Notes
-
Pie Chart
-
Stacked Bar
-
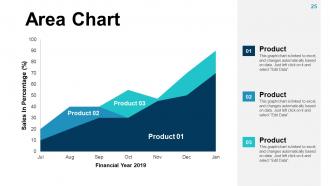
Area Chart
-
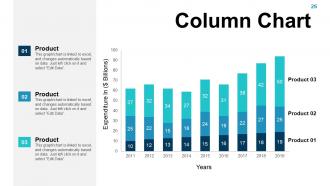
Column Chart
-
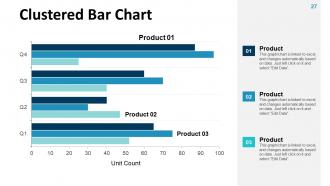
Clustered Bar Chart
-

Data Transformation
FAQs for Data transformation
So basically you pull data from wherever it lives, then clean up all the messy bits - missing stuff, weird formatting, inconsistencies. Standardize everything so it actually makes sense together. Apply whatever business logic you need and reshape it how you want. Validation is huge here - I can't stress this enough after debugging pipelines at 2am! Document what you're doing because you'll forget in like two weeks. Oh, and definitely test on a small chunk first before letting it rip on the full dataset. Load it into your target system and you're golden.
Oh man, data formats totally mess with your whole approach. CSV and JSON? Super easy since everything's predictable. XML gets annoying with all those nested tags everywhere - honestly such a pain. Then you've got completely unstructured stuff like PDFs where you're basically screwed without OCR tools. I usually just pick whatever works best - pandas handles CSVs perfectly, but you'll need special parsers for the messier formats. Really depends on how complex your source is and what you're trying to end up with.
Honestly, data quality can make or break your whole project. You know the saying - garbage in, garbage out. Bad source data with duplicates or missing stuff just creates a mess that spreads everywhere. Here's what I'd do: check your data quality *first* before transforming anything. Run some profiling to spot weird patterns early. Set up validation rules too. I learned this the hard way on a project last year - thought I could skip ahead but ended up redoing everything when my manager started asking questions about wonky numbers. Fix the issues upfront and you'll thank yourself later.
So basically ETL is just a fancy way of saying "make your messy data actually useful." You pull info from all your different systems - and trust me, they never talk to each other properly. Then you clean it up so everything matches format-wise. Finally dump it all in one place where your team can actually see what's happening. The whole point is avoiding that nightmare of manually pulling reports from like six different dashboards every week. Set up automated pipelines and you're golden - your data stays fresh without the headache. I'd start with whatever sources drive your biggest decisions first.
Honestly, just start with SQL and Python - those two will handle like 80% of whatever you're doing. Python's pandas library is clutch for data manipulation. R's great too if you're doing heavy statistical work, but Python's more versatile IMO. dbt is blowing up right now for data warehouse stuff, everyone and their mom is using it. For cloud work you've got AWS Glue, Azure Data Factory, Google Dataflow. Spark's still the go-to for huge datasets. Oh and if you hate coding, Tableau Prep or Power Query are pretty user-friendly. But seriously, learn SQL first - you can't escape it in this field.
So data transformation is what lets all your different data sources actually work together. Your CRM talks different than your spreadsheets, APIs have their own format - it's a mess without transformation. Picture it like getting everyone to speak the same language so your systems can understand each other. Otherwise you're stuck with these isolated data chunks that can't communicate. Honestly, the biggest mistake people make is jumping straight into building without planning first. Map out what formats you're starting with, figure out your end goal structure. Trust me, spending that time upfront will save you from wanting to throw your laptop out the window later.
Oh man, data quality issues will drive you absolutely nuts - nothing's consistent between departments and your legacy systems hate each other. Plus you'll have zero budget and good luck finding people who actually know this stuff. Everyone wants results immediately too, which is just realistic, right? Start with something small though, like a pilot project. Once you prove it works and people stop being scared of change, then you can expand. Integration's always messier than expected but at least you'll have buy-in by then.
Dude, you gotta try automating your data transformation stuff. All that tedious cleaning and formatting? Gone. Your analysts can actually do real work instead of copy-pasting spreadsheets for hours. I swear, once you set up those pipelines, it's like getting your life back. Way fewer screw-ups too since people aren't manually moving data around anymore. Oh, and don't go crazy at first - just pick one annoying task that keeps coming up and automate that. You'll see the difference pretty quick.
Honestly, data transformation makes a huge difference for model performance. Normalizing features puts everything on the same scale, which helps a ton. You'll also want to deal with missing values and encode categorical stuff properly - otherwise your algorithm can't even process it. Feature engineering is where things get interesting though. Creating new variables from your existing data often uncovers patterns you'd totally miss. Oh, and fixing skewed distributions or tossing outliers really helps models learn better. Just try different transformations during preprocessing and see what actually improves your validation scores.
So basically you want to encrypt everything - data moving around and data just sitting there. Access controls are huge too, only let the right people near it. I'd set up separate environments for the actual transformation work, keeps it away from your live systems. Security audits should happen regularly, and definitely mask any sensitive stuff during the process. Oh and logging is annoying but super necessary - you need to track who touched what. Start by figuring out where your riskiest data goes during transformation. That's where you'll need the heaviest security. It sounds like a lot but you get used to it pretty quick.
Start by profiling your data to see what mess you're working with. Remove duplicates first - that's usually the easy win. For missing values, you can either delete rows or fill them in with averages or whatever makes sense. Standardize stuff like dates and phone numbers so everything's consistent. Fix obvious typos and validate data types. Outliers are annoying because sometimes they're real, sometimes they're garbage - you'll have to use judgment there. Honestly, just tackle whatever will break your analysis first. Normalization helps too if you're comparing different scales.
So basically, data transformation lets you process stuff as it comes in rather than waiting around for those overnight batch jobs (which are painfully slow tbh). You can filter, aggregate, and clean your data in real-time. Your dashboards actually update instantly instead of showing yesterday's news. The trick is building a pipeline that won't choke on high-speed data flows. Honestly though, figure out what transformations you *actually* need right away versus what can sit in a queue. Not everything needs to be instant - that's where people mess up and overcomplicate things.
Think of metadata as your GPS for data transformation. It tells you what each field means, where stuff originated, and how to handle it properly. Skip this step and you'll definitely break something later - learned that the hard way! You'll need it to understand data types, field relationships, and any weird business rules. Also makes life easier when another dev inherits your code (they won't curse your name as much). Oh, and document everything upfront. Seriously. Future you will want to high-five present you for being thorough.
Okay so here's what I'd do - start with baseline measurements before changing anything, then track both the tech stuff AND business impact. Data quality matters (accuracy, speed, completeness) but honestly nobody cares if users aren't actually adopting it. Check if people are using the new systems, how fast decisions get made now, and whether you're saving money like you promised the bosses. ROI is huge obviously. I'd probably pick like 3-5 KPIs max that align with your goals and review quarterly - more than that gets messy to track.
Honestly, data transformation is a lifesaver for compliance stuff. You can standardize formats and clean up messy data that might trigger red flags during audits. The automatic masking and encryption features are clutch for GDPR and HIPAA - saves so much manual work. Regulators also love seeing proper audit trails and lineage docs, which you get as a bonus. Oh, and validation rules catch bad data before it screws up your systems. I'd start by mapping your compliance needs to specific transformation rules first. Trust me, your future self will thank you when audit season rolls around.
No Reviews