

Diversity And Inclusion Dashboard Inclusive Ppt Powerpoint Download




Try Before you Buy Download Free Sample Product
 Impress Your
 Audience
 100%
100% Editable
 Save Hours
 of Time


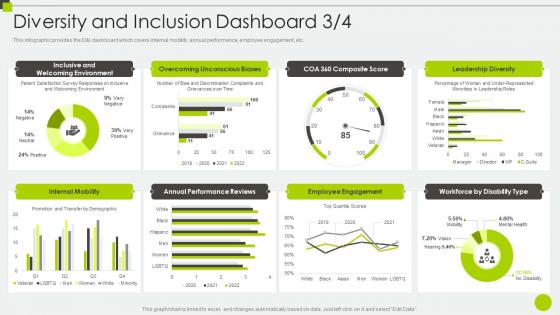
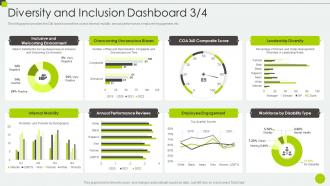
This infographic provides the D and I dashboard which covers internal mobility, annual performance, employee engagement, etc.
People who downloaded this PowerPoint presentation also viewed the following :
Diversity And Inclusion Dashboard Inclusive Ppt Powerpoint Download with all 7 slides:
Use our Diversity And Inclusion Dashboard Inclusive Ppt Powerpoint Download to effectively help you save your valuable time. They are readymade to fit into any presentation structure.





FAQs for Diversity And Inclusion Dashboard Inclusive
Key metrics for a Diversity and Inclusion Dashboard include demographic representation across all levels, pay equity ratios, recruitment and retention rates by demographic groups, promotion velocity, and employee engagement scores. These metrics enable organizations to track systemic progress, identify gaps in leadership pipelines, and measure inclusive culture effectiveness, with many companies finding that comprehensive measurement ultimately delivers enhanced innovation, better decision-making, and stronger competitive advantage.
Organizations ensure their Diversity and Inclusion Dashboard remains current by establishing regular data refresh cycles, incorporating real-time feedback mechanisms, and conducting quarterly relevance reviews with stakeholder input. Through automated data integration and continuous employee surveys, companies can track evolving diversity metrics, benchmark against industry standards, and adapt dashboard components to reflect changing organizational priorities, ultimately delivering actionable insights that drive meaningful inclusion outcomes.
Leadership plays a crucial role by setting strategic vision, allocating resources, ensuring data accuracy, and driving accountability across organizational levels. Effective leaders champion dashboard initiatives by modeling inclusive behaviors, communicating diversity goals transparently, and integrating insights into decision-making processes, with many organizations finding that executive commitment ultimately delivers sustained cultural transformation and measurable progress.
Data visualization enhances Diversity and Inclusion Dashboards by transforming complex demographic data into clear, actionable insights through interactive charts, heat maps, and trend analysis. These visual elements enable HR leaders and executives to quickly identify representation gaps, track progress across departments, and benchmark against industry standards, ultimately delivering faster decision-making and more strategic diversity initiatives.
Common pitfalls include focusing solely on demographic metrics without measuring inclusion culture, lacking leadership commitment and accountability, inadequate data collection processes, and failing to translate insights into actionable strategies. Organizations often struggle with data privacy concerns, resistance to transparency, and treating dashboards as compliance tools rather than strategic assets, with many finding that success requires comprehensive change management and clear communication about goals.
Qualitative data integrates into quantitative D&I dashboards through narrative summaries, sentiment analysis scores, themed feedback categories, and visual story elements alongside traditional metrics. Organizations combine employee survey comments, focus group insights, and exit interview themes with demographic data, creating comprehensive views that reveal both statistical trends and lived experiences, ultimately delivering deeper understanding of inclusion challenges and more targeted intervention strategies.
**INPUT**: What tools and software are best suited for creating a Diversity and Inclusion Dashboard? **OUTPUT**: Top tools for diversity and inclusion dashboards include Tableau, Power BI, Workday Analytics, SAP SuccessFactors, and specialized platforms like Culture Amp. These technologies streamline data visualization, automate reporting workflows, and integrate seamlessly with HRIS systems, with many organizations finding that comprehensive dashboards enhance transparency, accelerate decision-making, and ultimately deliver measurable progress toward inclusion goals.
A Diversity and Inclusion Dashboard fosters accountability by providing transparent metrics on hiring, promotion, retention, and pay equity across demographics, making progress visible to leadership and employees alike. Through real-time data visualization, organizations can identify gaps, track improvement initiatives, and set measurable goals, with many companies finding that this transparency drives meaningful cultural change and sustained commitment to inclusive practices.
Organizations can encourage dashboard participation through anonymous surveys, transparent communication about data usage, leadership modeling, incentive programs, and regular feedback sessions. By partnering with employee resource groups and demonstrating how collected insights drive policy changes, companies create trust and show tangible value, with many finding that emphasizing confidentiality and showcasing positive outcomes significantly increases voluntary participation rates.
A Diversity and Inclusion Dashboard can be customized by incorporating industry-specific metrics, compliance requirements, regulatory frameworks, and sector-relevant demographic indicators that align with each organization's unique operational context. For example, healthcare organizations might focus on patient care diversity outcomes while financial services emphasize lending equity metrics, with many companies finding that tailored dashboards deliver more actionable insights and strategic competitive advantages.
Best practices for presenting D&I metrics include using clear visualizations, establishing baseline comparisons, highlighting progress trends, segmenting data by departments or demographics, and connecting metrics to business outcomes. These approaches streamline stakeholder understanding by presenting actionable insights, contextualizing performance gaps, and demonstrating ROI, with many organizations finding that strategic dashboard design ultimately drives accountability and enhances decision-making across leadership teams.
Organizations can leverage diversity dashboard insights to refine job descriptions, expand sourcing channels to reach underrepresented communities, and identify hiring bias patterns through recruitment funnel analysis. These data-driven approaches enable companies to strategically target diverse talent pools, optimize interview processes, and track recruitment effectiveness, ultimately building more inclusive teams while enhancing their competitive advantage in talent acquisition.
A Diversity and Inclusion Dashboard facilitates team dialogue by providing transparent metrics on representation, pay equity, promotion rates, and engagement scores, creating data-driven conversations about progress and challenges. These visualizations enable teams to identify specific areas for improvement, celebrate successes, and collaborate on targeted initiatives, ultimately fostering accountability and meaningful engagement around inclusive practices.
Progress on Diversity and Inclusion Dashboard can be communicated through annual sustainability reports, dedicated diversity sections in quarterly investor updates, social media campaigns highlighting milestone achievements, and transparent website portals showcasing real-time metrics. Many organizations find that combining these approaches with industry conference presentations and stakeholder webinars ultimately delivers enhanced brand reputation, stronger investor confidence, and competitive advantage in talent acquisition markets.
Intersectionality plays a crucial role by enabling organizations to track overlapping identities like race-gender combinations, age-disability intersections, and ethnicity-sexual orientation demographics rather than viewing diversity categories in isolation. This comprehensive approach helps companies identify specific gaps, such as underrepresentation of women of color in leadership or accessibility challenges for older LGBTQ+ employees, ultimately delivering more targeted inclusion strategies and equitable outcomes.
-
Very well designed and informative templates.
-
SlideTeam is very efficient when it comes to saving time. I am happy that I chose them for my presentation.