


Economic order quantity eoq model powerpoint presentation examples




Try Before you Buy Download Free Sample Product
 Impress Your
 Audience
 100%
100% Editable
 Save Hours
 of Time


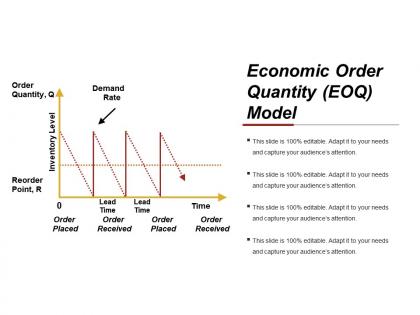
Introducing Economic Order Quantity EOQ Model PowerPoint Presentation Examples. Employing this warehouse management PowerPoint layout you can showcase the evaluation of the optimal reorder quantity to ensure the instantaneous replenishment of inventory with no shortages. Importance of EOQ and the formula of determining the total cost per order by the cost of holding inventory and the cost of ordering that inventory can be highlighted using this inventory optimization PowerPoint theme. Using this inventory management PPT layout you can describe the process to determine the volume and frequency of orders required to satisfy demand while minimizing the cost per order. The basic EOQ equation can be illustrated using the graphical representation of the EOQ model graph using this inventory accounting PPT slide. With the graphical representation of the production scheduling model, you can describe the relationship between order quantity and order received along with demand rate estimation using our cost curve PPT template. Hence download this stock management PowerPoint theme for successful inventory management.
People who downloaded this PowerPoint presentation also viewed the following :
Economic order quantity eoq model powerpoint presentation examples with all 5 slides:
Bring folks around to feeling appreciated again with our Economic Order Quantity Eoq Model Powerpoint Presentation Examples. Enable folks to get over the jilt.


FAQs for Economic order quantity eoq model
So EOQ is basically about finding that sweet spot for order quantities - you don't want to order constantly (costs add up fast) but you also can't just stockpile everything. The formula is EOQ = √(2DS/H) where D is your yearly demand, S is what each order costs you, and H is holding costs per unit annually. Honestly looks way more intimidating than it really is. Works best when you've got predictable demand and lead times, so I'd start with your bread-and-butter products first. Skip the weird seasonal stuff initially - trust me on that one. It'll save you from ordering too much or running around placing orders every other day.
So basically EOQ finds the perfect balance between ordering costs and holding costs - it's where those two expense lines cross at the lowest point. You know how ordering all the time jacks up your admin costs, but then holding tons of inventory gets expensive too? This formula just calculates exactly how much to order so you're not dealing with either problem. Honestly the math behind it is pretty cool once you see it work. Just plug in your actual numbers and see what happens - I bet you'll find some decent savings just from changing up your order quantities. Worth a shot anyway.
So you need three things for EOQ - demand rate, ordering cost, and holding cost. Demand rate is just how much inventory you burn through each year. Ordering cost covers placing orders, receiving stuff, all that admin work. Then there's holding cost which includes storage, insurance, plus the money you've got tied up sitting there. Finance people love to lowball holding costs though, which drives me crazy. The whole formula finds that sweet spot where your total costs hit rock bottom. Just make sure your data's solid first - crappy numbers in means crappy results out.
So here's the thing - EOQ totally falls apart when demand gets crazy unpredictable. The whole model banks on steady demand, but that's pretty rare honestly. You'll get stuck with way too much stuff sitting around when things are slow, then run out completely when everyone suddenly wants your product. The "optimal" order amount becomes kind of meaningless once demand starts bouncing all over the place. I'd say look into safety stock instead - gives you a buffer. Or maybe try something more flexible that actually adjusts to what's happening instead of just sticking with EOQ.
Honestly, EOQ breaks down pretty fast in real life. Cash flow problems mean you can't always afford the "perfect" quantity - been there. Storage space is another killer, especially with stuff that goes bad quickly. Your suppliers don't care about your math either - they'll hit you with minimum orders or tempting bulk discounts that throw everything off. Seasonal businesses? Forget about it. The steady demand assumption goes right out the window. Start with EOQ to get a baseline, but then you've gotta work around whatever constraints you're actually dealing with. It's more art than science sometimes.
So EOQ assumes your lead time stays the same and demand is super predictable - like customers want exactly the same amount every period. No seasonal stuff or weird fluctuations. You're also supposed to know your demand rate perfectly, which... good luck with that in the real world, right? Variable lead times? Forget about it. Random demand spikes? The model basically shrugs. If you're dealing with unreliable suppliers or your sales go crazy during certain seasons, you'll need to tweak the basic EOQ formula or find something more advanced. Works great in theory though!
So instead of doing EOQ separately for each product, you'd use a multi-product model that looks at everything together. Group items by supplier or storage needs first - makes your life way easier. The math gets pretty intense with Lagrange multipliers and all that, but the basic idea is simple enough. You're just weighing ordering costs against holding costs for your whole product line at once. Takes into account shared warehouse space, bulk discounts, combined shipping - stuff like that. Honestly, most companies I know start with the grouping approach because it's more realistic than trying to optimize everything simultaneously.
So carrying cost is half the EOQ puzzle - it fights against your ordering costs to find the sweet spot. When carrying costs spike (storage, insurance, stuff going bad, cash tied up), your optimal order gets smaller because you don't want inventory just sitting there bleeding money. That closet analogy is spot on - pure expensive real estate! Lower carrying costs? You can order bigger batches less often. The math puts carrying cost in the denominator, so higher cost = lower EOQ. Honestly, most companies just throw around 20-25% without actually calculating their real number. Worth double-checking yours.
So EOQ and JIT are pretty much opposites when it comes to inventory. EOQ wants you ordering bigger batches less often to cut total costs. JIT? Complete opposite - smaller orders way more frequently to keep inventory super low. Honestly, JIT basically ignores the whole EOQ formula thing. It's all about cutting waste and storage costs instead of hitting some "perfect" order amount. The catch is JIT only works well if your suppliers are solid and demand stays predictable. I'd say check your supplier relationships first, then see if keeping inventory minimal beats those EOQ savings.
Yeah, EOQ is basically useless when markets get crazy. It assumes demand and costs never change - which is laughable if you've worked in retail or manufacturing lately. Your demand spikes during holidays? Supplier jacks up prices randomly? The model just breaks. Honestly, I've seen companies waste so much time trying to make EOQ work in unstable environments. Just-in-time inventory makes way more sense when things keep shifting. Or build in some safety stock buffers so you're not scrambling when disruptions hit. EOQ's great for textbooks, terrible for real-world volatility.
So tech basically supercharges EOQ by automating everything and pulling in live data. IoT sensors track your actual stock levels, AI gets way better at predicting demand, and your ERP system can auto-reorder at the perfect time. Machine learning tweaks the formula based on seasons and market shifts - honestly pretty slick. Cloud platforms run calculations across all your locations at once too. I'd start by seeing what data you've already got, then find software that connects it all. Makes ordering decisions way smarter without you having to crunch numbers constantly.
There's a bunch of software that'll handle EOQ for you. Dedicated inventory tools like Fishbowl, inFlow, and Zoho Inventory are solid choices. Big ERP systems like SAP and Oracle have the calculations built right in too. Excel works fine if you're just testing things out - I actually started there myself. Most modern inventory software figures out your optimal order quantities automatically once you plug in demand patterns, carrying costs, and ordering costs. Pick something that plays well with whatever systems you're already using. I'd map out your current setup first, then see which tools actually integrate without being a total headache.
Yeah, so EOQ is solid as your starting point - gives you that baseline number to work with. Then you can stack other stuff on top depending on what you're dealing with. ABC analysis works great with it for your expensive items, and safety stock calculations help when demand gets weird. JIT is honestly kind of the opposite philosophy since it's all about keeping inventory super low rather than finding the "perfect" order size. MRP systems can use EOQ too, but mainly for independent demand items. Short answer - use EOQ as your foundation, then tweak it based on whatever constraints you're actually facing. Works way better than trying to force one approach.
Yeah, regular EOQ is pretty useless for perishable stuff. It basically pretends your inventory will last forever, which is... not how bananas work lol. You need models that actually factor in spoilage rates and expiration dates from the get-go. There are modified EOQ versions that include deterioration costs, or you could look into inventory models built specifically for perishables. Trust me, you don't want to end up with a warehouse full of expired yogurt because your math didn't account for shelf life. Start with spoilage rates first, then optimize around that.
So when your actual orders keep differing from EOQ, that's actually telling you something useful about what's really happening vs what the model assumes. You might be ordering way more because of bulk discounts EOQ didn't factor in, or less because carrying costs are higher than you thought. Cash flow problems, supply chain hiccups, seasonal swings - all that stuff shows up in these patterns. Honestly, I'd track these deviations pretty closely since they usually reveal chances to renegotiate with suppliers or tweak your inventory approach.
-
Very unique and reliable designs.
-
Thanks for all your great templates they have saved me lots of time and accelerate my presentations. Great product, keep them up!