

Ejemplo de presentación de diapositivas de presentación de Powerpoint de producto





Try Before you Buy Download Free Sample Product
 Impress Your
Audience
 100%
Editable
 Save Hours
of Time


Explore nuestro ejemplo de presentación de diapositivas de presentación de PowerPoint de producto. Incorpore estas diapositivas de PPT para evaluar nuevas estrategias de ideas de productos y tendencias del mercado. La plataforma de competencia de introducción de nuevos productos consta de plantillas listas para el contenido, como selección de ideas de productos, comprensión de las necesidades del cliente, comprensión de las necesidades del cliente, fuentes externas e internas de nuevas ideas de productos, hoja de ruta del producto, análisis de categorías, ciclo de vida del producto, herramientas y técnicas, matriz BCG, mapa de empatía modelo kano, análisis de mercado, mapeo del mercado de productos, estrategias competitivas, atractivo del mercado, planes de desarrollo y fabricación, plan de lanzamiento de marketing, plantilla de presupuesto, estrategia de reposicionamiento, creación de preferencia de marca, análisis de costes de marketing y lanzamiento, revisión de viabilidad del producto, control de calidad del producto , inicie el panel de monitoreo y más. Todas las diapositivas son fáciles de personalizar. Los usuarios pueden agregar o eliminar contenido si es necesario. Demuestre la estrategia de desarrollo de nuevos productos con este producto. Presentación visual de PowerPoint. Descargue NPI Presentation para presentar y comercializar con éxito su último producto o servicio.
People who downloaded this PowerPoint presentation also viewed the following :
Contenido de esta presentación de Powerpoint
Diapositiva 1 : Esta diapositiva presenta un ejemplo de presentación del producto. Indique el nombre de su empresa y comience.
Diapositiva 2 : Esta es una diapositiva de Agenda. Exprese sus agendas aquí.
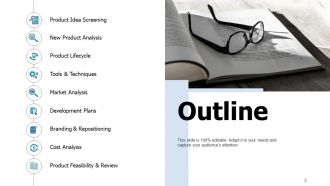
Diapositiva 3 : Esta diapositiva muestra el esquema como: selección de ideas de productos, análisis de nuevos productos, ciclo de vida del producto, herramientas y técnicas, análisis de mercado, planes de desarrollo, marca y reposicionamiento, análisis de costos, viabilidad y revisión del producto.
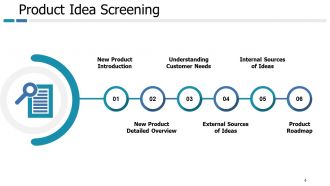
Diapositiva 4 : Esta diapositiva presenta la selección de ideas de productos que describe: introducción de nuevos productos, descripción general detallada de nuevos productos, comprensión de las necesidades del cliente, fuentes externas de ideas, fuentes internas de ideas, hoja de ruta del producto.
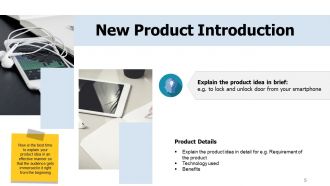
Diapositiva 5 : esta diapositiva muestra la introducción de nuevos productos. Explique la idea del producto en detalle, por ejemplo, los requisitos del producto, la tecnología utilizada, etc.
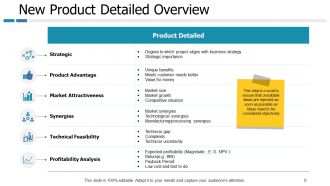
Diapositiva 6 : Esta diapositiva representa la descripción general detallada del producto nuevo.
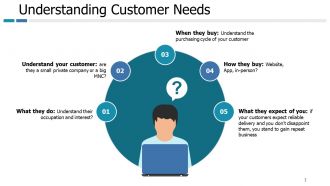
Diapositiva 7 : Esta diapositiva muestra Comprensión de las necesidades del cliente y describe: ¿Qué hacen? ¿Comprenden su ocupación e interés? Comprenda a su cliente: ¿es una pequeña empresa privada o una gran multinacional? Cuando compran: comprenda el ciclo de compra de su cliente. Lo que esperan de usted: si sus clientes esperan una entrega confiable y usted no los decepciona, puede obtener negocios repetidos. Cómo compran: sitio web, aplicación, en persona?
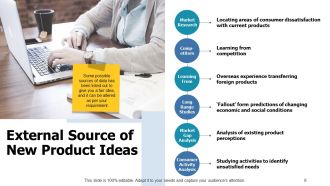
Diapositiva 8 : Esta diapositiva muestra la fuente externa de ideas de nuevos productos que describen: experiencia en el extranjero en la transferencia de productos extranjeros, aprendizaje de, competidores, estudios de largo alcance, análisis de brechas de mercado, análisis de actividad del consumidor, investigación de mercado.
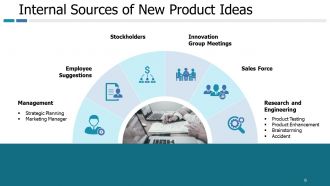
Diapositiva 9 : Esta diapositiva presenta las fuentes internas de ideas de nuevos productos que describen: administración, sugerencias de los empleados, accionistas, reuniones del grupo de innovación, fuerza de ventas, investigación e ingeniería.
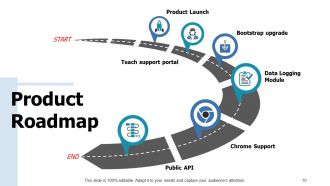
Diapositiva 10 : Esta diapositiva muestra la hoja de ruta del producto como: lanzamiento del producto, módulo de registro de datos, actualización de Bootstrap, portal de soporte de enseñanza, soporte de Chrome, API pública.
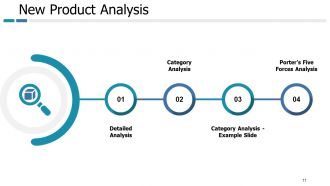
Diapositiva 11 : Esta diapositiva representa el análisis de nuevos productos que describe: análisis detallado, análisis de categorías, diapositiva de ejemplo, análisis de categorías, análisis de las cinco fuerzas de Porter.
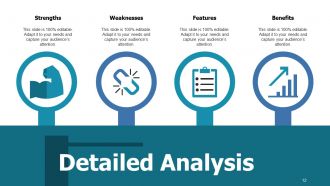
Diapositiva 12 : Esta diapositiva muestra un análisis detallado con: fortalezas, debilidades, características y beneficios.
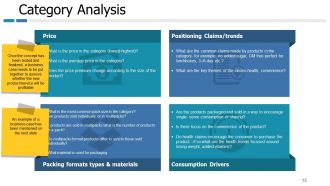
Diapositiva 13 : Esta diapositiva muestra el análisis de categorías con afirmaciones / tendencias de posicionamiento, precio, tipos y materiales de formatos de embalaje, impulsores de consumo.
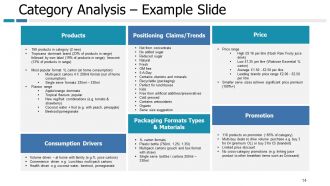
Diapositiva 14 : Esta diapositiva presenta Análisis de categorías - Diapositiva de ejemplo.
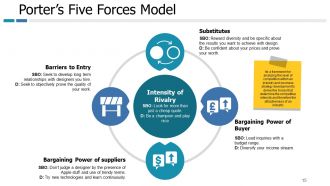
Diapositiva 15 : Esta diapositiva muestra el modelo de las cinco fuerzas de Porter que describe: intensidad de la rivalidad, barreras de entrada, sustitutos, poder de negociación de los proveedores, poder de negociación del comprador.
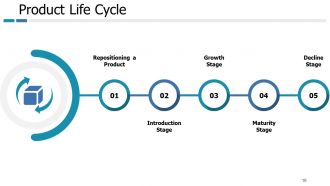
Diapositiva 16 : Esta diapositiva representa el ciclo de vida del producto como: etapa de introducción, etapa de madurez, reposicionamiento de un producto, etapa de crecimiento, etapa de declive.
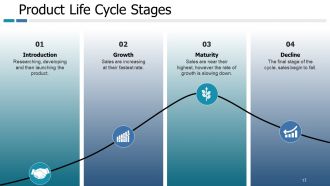
Diapositiva 17 : Esta diapositiva muestra las etapas del ciclo de vida del producto que describen: introducción, crecimiento, madurez y declive.
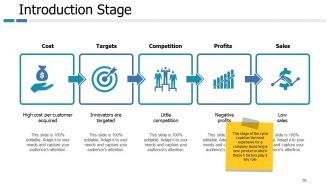
Diapositiva 18 : Esta diapositiva muestra la etapa de introducción con: costo, objetivos, competencia, ganancias, ventas.
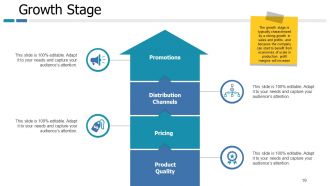
Diapositiva 19 : Esta diapositiva presenta la Etapa de crecimiento con los siguientes puntos: Promociones, Canales de distribución, Precios, Calidad del producto.
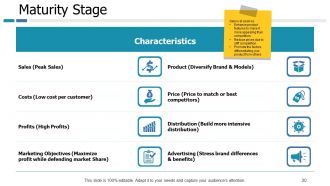
Diapositiva 20 : Esta diapositiva muestra la etapa de madurez.
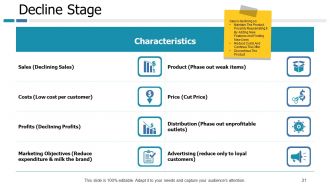
Diapositiva 21 : Esta diapositiva representa la etapa de declive.
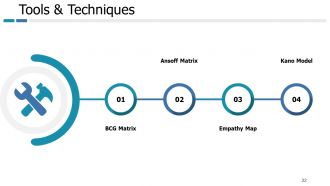
Diapositiva 22 : Esta diapositiva muestra herramientas y técnicas como: matriz BCG, mapa de empatía, matriz de Ansoff, modelo de Kano.
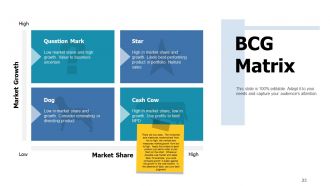
Diapositiva 23 : Esta diapositiva muestra la matriz BCG.
Diapositiva 24 : Esta diapositiva presenta la Matriz de Ansoff.
Diapositiva 25 : Esta diapositiva muestra el Mapa de empatía para generar todos los posibles segmentos de clientes a los que podría querer vender su producto.
Diapositiva 26 : esta diapositiva representa el mapa de Kano.
Diapositiva 27 : Esta diapositiva representa el análisis de mercado que describe: segmentación del mercado, estrategias competitivas, mapeo del mercado de productos, atractivo del mercado.
Diapositiva 28 : Esta diapositiva muestra la segmentación del mercado con factores como: geográfico, demográfico, psicográfico, conductual.
Diapositiva 29 : Esta diapositiva muestra el mapeo del mercado de productos.
Diapositiva 30 : Esta diapositiva presenta Estrategias competitivas en forma de matriz.
Diapositiva 31 : Esta diapositiva muestra el atractivo del mercado.
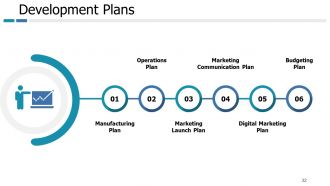
Diapositiva 32 : Esta diapositiva representa los planes de desarrollo que describen: plan de fabricación, plan de lanzamiento de marketing, plan de marketing digital, plan de operaciones, plan de comunicación de marketing, plan de presupuesto.
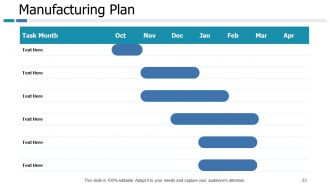
Diapositiva 33 : Esta diapositiva muestra el plan de fabricación.
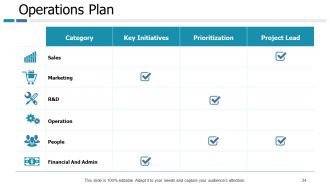
Diapositiva 34 : Esta diapositiva representa el plan de operaciones.
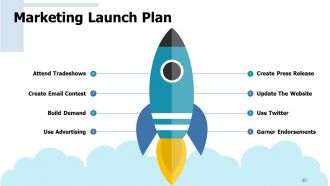
Diapositiva 35 : Esta diapositiva muestra el plan de lanzamiento de marketing como: crear un comunicado de prensa, actualizar el sitio web, usar Twitter, obtener respaldo, asistir a ferias comerciales, crear un concurso de correo electrónico, generar demanda, usar publicidad.
Diapositiva 36 : Esta diapositiva muestra el plan de comunicación de marketing como: marketing directo, relaciones públicas, venta personal, promoción de ventas, publicidad.
Diapositiva 37 : esta diapositiva presenta el plan de marketing digital.
Diapositiva 38 : Esta diapositiva muestra la plantilla presupuestaria en forma tabular.
Diapositiva 39 : Esta diapositiva representa la marca y el reposicionamiento como: estrategia de reposicionamiento, etapa de madurez, reposicionamiento de un producto, etapa de crecimiento, etapa de declive.
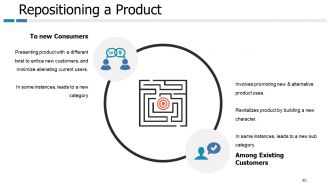
Diapositiva 40 : Esta diapositiva muestra Cómo reposicionar un producto para nuevos consumidores y entre clientes existentes.
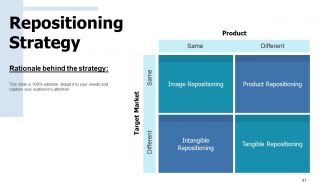
Diapositiva 41 : Esta diapositiva representa la estrategia de reposicionamiento en forma de matriz.
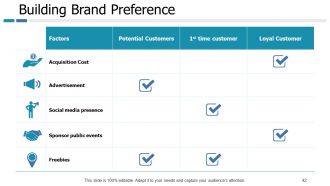
Diapositiva 42 : Esta diapositiva muestra la creación de preferencias de marca en forma de tabla.
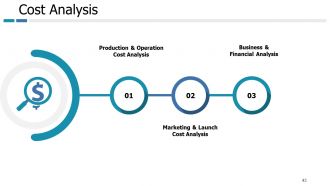
Diapositiva 43 : Esta diapositiva representa Análisis de costos como: Análisis de costos de lanzamiento y marketing, Análisis de costos de producción y operación, Análisis comercial y financiero.
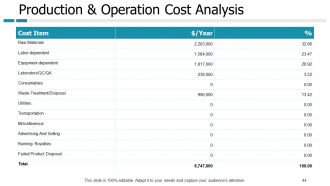
Diapositiva 44 : Esta diapositiva muestra el Análisis de costos de producción y operación en forma de tabla.
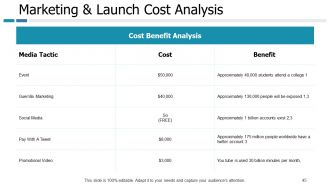
Diapositiva 45 : Esta diapositiva muestra Marketing y análisis de costos de lanzamiento.
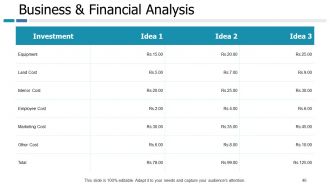
Diapositiva 46 : Esta diapositiva presenta Análisis comercial y financiero.
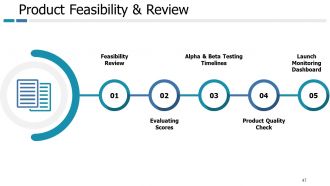
Diapositiva 47 : Esta diapositiva muestra la viabilidad y revisión del producto con: evaluación de puntajes, control de calidad del producto, revisión de viabilidad, cronogramas de pruebas alfa y beta, panel de control de lanzamiento.
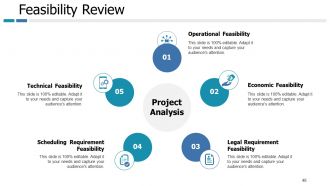
Diapositiva 48 : Esta diapositiva representa la Revisión de viabilidad que describe: Viabilidad operativa, Viabilidad económica, Viabilidad del requisito legal, Viabilidad del requisito de programación, Viabilidad técnica.
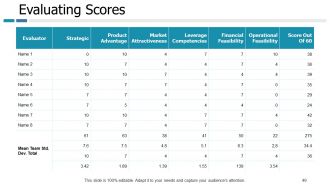
Diapositiva 49 : Esta diapositiva muestra la evaluación de puntuaciones en forma de tabla.
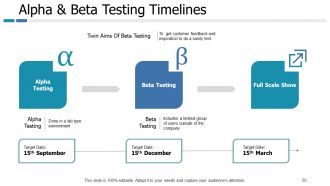
Diapositiva 50 : Esta diapositiva muestra los cronogramas de las pruebas alfa y beta.
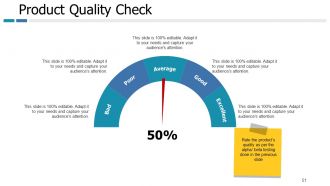
Diapositiva 51 : Esta diapositiva presenta el Control de calidad del producto para calificar la calidad del producto según las pruebas alfa / beta realizadas en la diapositiva anterior.
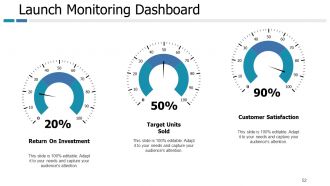
Diapositiva 52 : Esta diapositiva muestra los paneles de control de lanzamiento de retorno de la inversión, unidades objetivo vendidas, satisfacción del cliente.
Diapositiva 53 : Esta diapositiva recuerda unos 30 minutos de pausa para el café.
Diapositiva 54 : Esta diapositiva muestra un ejemplo de presentación de iconos de productos.
Diapositiva 55 : Esta es otra diapositiva que continúa Ejemplo de presentación de iconos de productos.
Diapositiva 56 : esta diapositiva se titula Diapositivas adicionales para avanzar.
Diapositiva 57 : Esta es la diapositiva de Nuestra misión con imágenes relacionadas.
Diapositiva 58 : Esta es la diapositiva de Nuestro equipo con nombres y designaciones.
Diapositiva 59 : Esta es la diapositiva Acerca de nosotros para mostrar las especificaciones de la empresa, etc.
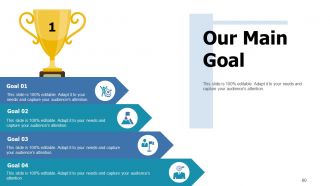
Diapositiva 60 : Esta es la diapositiva de Nuestro objetivo principal. Muestre sus metas importantes aquí.
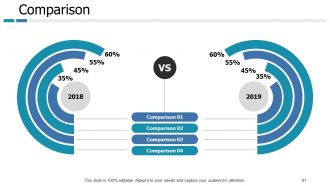
Diapositiva 61 : Esta es una diapositiva de comparación para establecer una comparación entre productos básicos, entidades, etc.
Diapositiva 62 : Esta es la diapositiva de Nuestro objetivo principal. Muestra tus objetivos aquí.
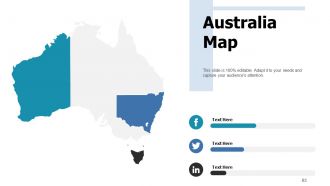
Diapositiva 63 : esta diapositiva muestra el mapa de Australia.
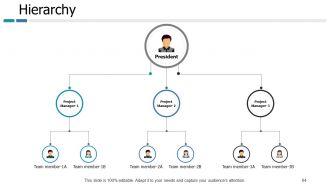
Diapositiva 64 : Esta es una diapositiva de jerarquía con los nombres y la designación de los miembros.
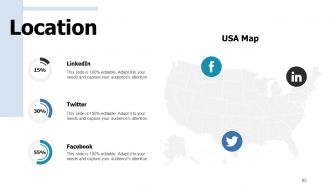
Diapositiva 65 : Esta es una diapositiva de ubicación con un mapa de EE. UU.
Diapositiva 66 : Esta es la diapositiva Contáctenos con la dirección del edificio, el teléfono, el correo electrónico y el horario comercial.
Ejemplo de presentación de diapositivas de presentación de Powerpoint de producto con las 66 diapositivas:
Nuestro ejemplo de presentación de producto Las diapositivas de presentación en PowerPoint son como un fuselaje. Ellos llevarán sus pensamientos a lo alto.
-
Example Presentation of Product
-
Agenda Slide
-
Outline
-
Product Idea Screening
-
New Product Introduction
-
New Product Detailed Overview
-
Understanding Customer Needs
-
External Source of New Product Ideas
-
Internal Sources of New Product Ideas
-
Product Roadmap
-
New Product Analysis
-
Of Product
-
Category Analysis
-
Category Analysis Example Slide
-
Porter s Five Forces Model
-
Product Life Cycle
-
Product Life Cycle Stages
-
Introduction Stage
-
Growth Stage
-
Maturity Stage
-
Decline Stage
-
Tools Techniques
-
BCG Matrix
-
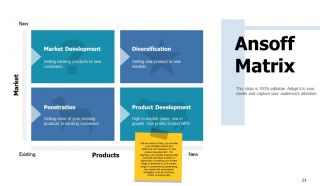
Ansoff Matrix
-
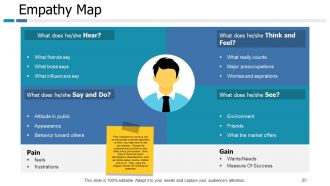
Empathy Map
-
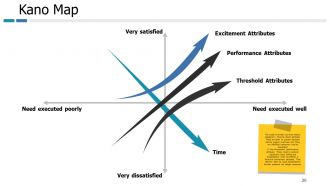
Kano Map
-
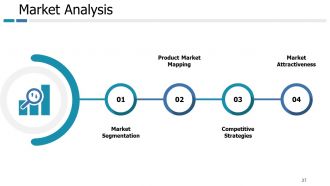
Market Analysis
-
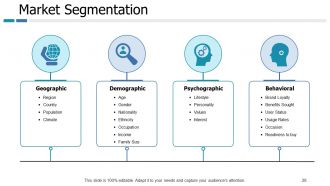
Market Segmentation
-
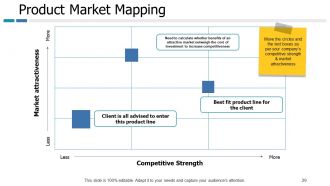
Product Market Mapping
-
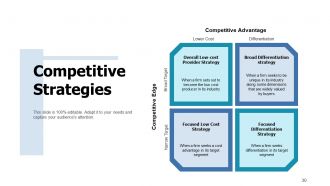
Competitive Strategies
-
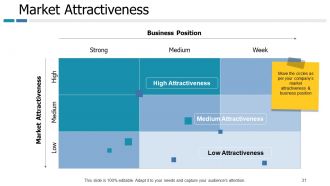
Market Attractiveness
-
Development Plans
-
Manufacturing Plan
-
Operations Plan
-
Marketing Launch Plan
-
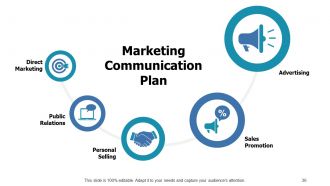
Marketing Communication Plan
-
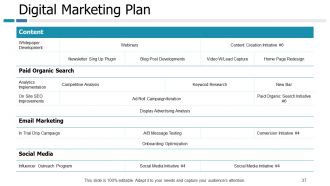
Digital Marketing Plan
-
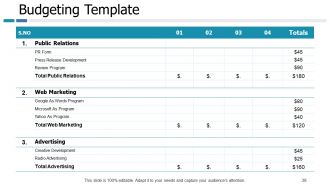
Budgeting Template
-
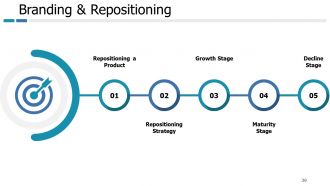
Branding Repositioning
-
Repositioning a Product
-
Repositioning Strategy
-
Building Brand Preference
-
Cost Analysis
-
Production Operation Cost Analysis
-
Marketing Launch Cost Analysis
-
Business Financial Analysis
-
Product Feasibility Review
-
Feasibility Review
-
Evaluating Scores
-
Alpha Beta Testing Timelines
-
Product Quality Check
-
Launch Monitoring Dashboard
-

Coffee Break
-
Example Presentation of Product Icons Slide
-
Example Presentation of Product Icons Slide Contd
-
Additional Slides
-

Our Mission
-
Our Team
-

About us
-
Our Main Goal
-
Comparison
-
Our Main Target
-
Australia Map
-
Hierarchy
-
Location
-

Contact Us
FAQs for Example Presentation Of Product
Know your audience first - that's everything. Lead with the problem you're solving, not a feature dump. People need to feel the pain point before you show them the cure. Good visuals are non-negotiable because honestly, boring slides kill deals faster than bad pricing. Practice until it flows naturally - nobody wants to hear you read bullet points like a robot. Story beats statistics every time. Questions are where the magic happens, so save time for them. Always end with something concrete like "I'll email you the contract Monday." That specificity matters way more than you'd think.
Okay so here's what I've figured out - complex stuff becomes way more digestible when you break it into chunks. Clean layouts are your best friend. Use consistent colors and don't be afraid of white space (seriously, cramming everything together just stresses people out). Icons beat text walls every time since our brains are wired for visuals. I've sat through way too many demos where everyone's eyes just... died. Typography hierarchy is clutch - it naturally guides people through your points. Oh, try squinting at your next presentation. If you can still spot the main elements while squinting, you've nailed the visual flow.
Dude, forget listing features like a robot - nobody cares about that stuff. Tell a story instead! People connect when they hear how your product actually solved someone's problem. Like, paint a picture of a customer who was struggling with the exact same issue your audience faces. Then boom - your product swoops in and saves the day. Honestly, stories just make everything click better than technical explanations ever will. Structure it simple: problem, solution, happy ending. I always kick off presentations with a customer story now and the difference in engagement is night and day.
Honestly, you've got to figure out what each group actually gives a damn about first. Executives? They want ROI and big picture stuff - bore them with technical details and you're dead in the water. Tech people are the opposite - they want specs and nitty gritty implementation. End users just care if it'll make their job easier, period. I totally bombed a presentation to senior leadership once by diving into feature specs when they clearly just wanted to know the bottom line impact. Now I always research who's in the room beforehand. Quick tip: ask yourself what's actually keeping that specific audience up at night, then lead with that. Makes all the difference.
Don't dump features on people - talk benefits instead. Also way too much info kills presentations dead. Nobody cares about your 47 bullet points, trust me. Test your demo setup beforehand or you'll crash spectacularly in front of everyone (been there). Those cookie-cutter PowerPoint templates? Trash them. Know who you're presenting to and actually speak their language. Oh, and practice your timing - I can't tell you how many people rush through the good stuff because they spent forever on boring intro slides. Short version: less is more, benefits over features, and for the love of god test everything first.
Honestly, just stick to the metrics that actually matter to the business. Conversion rates, engagement, retention - that stuff directly shows impact. Revenue growth is obviously huge too. Customer satisfaction scores help, but don't go overboard with data. I've sat through way too many presentations where someone dumps like 15 different charts on us. Pick maybe 3-4 key numbers that tell a real story. The trick is being able to explain what each one means for the company and why anyone should care about it in the first place.
Multimedia can totally make or break your presentation. Videos are perfect for showing features in action - way better than just talking about them. For complex data, infographics help people actually get it instead of glazing over. Don't go overboard though! I've sat through so many presentations that were just random videos and graphics thrown together with zero point. Every piece needs a reason to be there. Also, definitely test your tech beforehand because it'll crash right when you need it most (Murphy's law, right?). The whole goal is making your product benefits super clear, so pick visuals that actually help people understand, not just pretty eye candy.
Grab them right away with something unexpected - weird stat, bold question, whatever makes them actually look up from their phones. Visuals over text always. Nobody reads bullet point novels, trust me. Instead of rattling off features, tell stories about actual customers doing cool stuff with your product. Mix in some interaction too - quick polls work, or just ask what they think about something. Oh, and practice those transitions between slides beforehand. Nothing kills momentum like awkwardly fumbling to your next point. You want it to feel like you're just having a chat, not delivering some corporate presentation.
Okay so here's what works for me - get someone to look at your slides beforehand, like a coworker or whoever. They'll spot the weird stuff you missed. Then during the actual thing, just watch people's faces. Are they lost? Bored? I literally pause and ask "making sense so far?" It feels awkward but saves your butt. Oh and the follow-up part is huge - text or email them within a day or two asking what hit and what didn't. Don't just ask "how was it" though, that's useless. Be specific about what you want to know.
Pick something that actually fits your brand vibe and don't go crazy with colors or fonts - I've watched so many pitches crash because someone went overboard with flashy animations. Beyond swapping out logos, actually customize the thing. Let your content shape the structure instead of forcing it into random template boxes. One main point per slide works best. Use decent product photos and definitely test how everything looks on whatever screen you'll be using. Oh and practice with your template first so you're not randomly clicking around during the actual presentation looking lost.
Okay so first - stop saying "contact us" because that's way too vague. Tell people exactly what you want them to do: "schedule your free consultation" or "download the guide now." Action words work better than weak stuff like "consider." Also, never end with "any questions?" - it just kills all your momentum. Create urgency instead! "First 10 people get a bonus" or "expires this Friday." Put your CTA right on screen with contact info so they can't miss it. Oh, and always remind them of the main benefit they'll get, then boom - tell them their next move immediately.
Honestly, just know your stuff inside and out - that's half the battle right there. I always practice in front of a mirror (sounds weird but it works). Focus on helping them instead of worrying about yourself looking stupid. Slow down when you talk - we all speed up when we're nervous, and it shows. Oh, and stand up straight! Makes a huge difference. Start with a question to get them talking instead of just staring at you. Even experienced people get butterflies without prep, so don't feel bad about rehearsing your main points until they're second nature.
Dude, cultural stuff makes a huge difference in presentations. Japanese customers want all the technical details with subtle messaging - no flashy BS. Americans? Totally opposite - they love bold claims and benefit-heavy copy. Europeans are somewhere in between but lean toward understated elegance (flashy graphics will backfire there, trust me). Even colors are tricky. Red's lucky in China but screams "danger" to Western audiences. You've gotta match their communication style too - some cultures hate direct messaging while others think beating around the bush is annoying. Just research your audience first, saves you tons of headaches later.
Dude, you absolutely need a prototype or demo. People zone out during slide decks - we've all been there. But show them something they can actually touch and click? Game changer. It proves your idea isn't just theoretical BS and helps you catch problems before they become expensive disasters. Decision-makers get it way faster when they can see it in action. Those "holy shit, this actually works" moments? You can't get that from PowerPoint. My take: demo first, then maybe throw in a few slides if you need to. Way more effective that route.
Honestly, I always look at two things - what happens during the presentation and what comes after. Watch your audience while you're talking. Are they scribbling notes or scrolling Instagram? Send out a quick survey the next day asking if everything made sense and what they're planning to do next. The real test though is the follow-up stuff over the next few weeks. Did people actually book those demo calls you mentioned? Any trial signups? Track your email responses too - that's where you'll see if anyone's genuinely interested. Set clear goals beforehand so you're not just guessing if it worked.
-
It's is a beautiful slide. Helpful for my upcoming projects
-
Its helpfull
-
Good ppt