


Facilities Management Dashboard With Repair Services And Work Facility Management




Try Before you Buy Download Free Sample Product
 Impress Your
 Audience
 100%
100% Editable
 Save Hours
 of Time


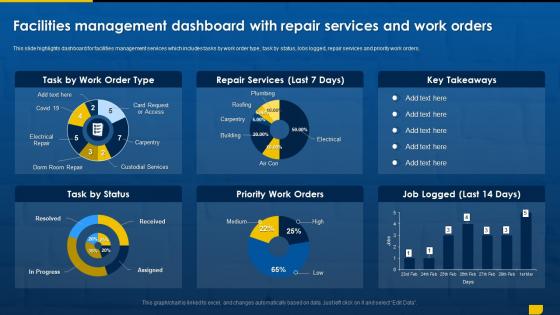
This slide highlights dashboard for facilities management services which includes tasks by work order type, task by status, lobs logged, repair services and priority work orders.
People who downloaded this PowerPoint presentation also viewed the following :
Facilities Management Dashboard With Repair Services And Work Facility Management with all 10 slides:
Use our Facilities Management Dashboard With Repair Services And Work Facility Management to effectively help you save your valuable time. They are readymade to fit into any presentation structure.









FAQs for Facilities Management Dashboard With Repair Services And
So definitely track work order completion rates, response times, and maintenance costs per square foot first. Space utilization too - that one's huge. Energy consumption and vendor performance scores are solid additions. Asset uptime is honestly clutch when your boss starts freaking out about broken equipment again. If you're doing office spaces, throw in tenant satisfaction scores. Pick maybe 6-8 max though or your dashboard becomes this overwhelming mess nobody wants to look at. I'd start there and see what other questions people keep bugging you about - you can always add more later.
Honestly, these dashboards are game-changers for spotting problems before they blow up your budget. Real-time data shows energy patterns, maintenance schedules, all that stuff in one view instead of hunting through endless spreadsheets (which is soul-crushing). Set up alerts for your key metrics first - trust me on this one. That way you're not constantly playing catch-up when things break. You can see exactly which areas need attention and actually plan your resources instead of just throwing money at whatever's screaming loudest. Makes space planning and budget decisions way less stressful too.
Honestly, real-time data is what makes dashboards actually useful instead of just pretty. You're flying blind otherwise - like trying to manage a building while looking at yesterday's info. HVAC goes down? You'll know instantly instead of finding out when tenants start complaining. Same with security issues or maintenance problems. The speed thing is huge for resource decisions too. I'd probably start by figuring out what data you actually need live (temperature, alerts) versus stuff that can update every few hours. Most people go overboard at first.
Honestly, user feedback is everything for dashboard design. It shows you the huge gap between what you think facilities managers need versus what they're actually doing every day. You'll find out which KPIs they care about, how they want to see data, what feels annoying to use. So many dashboards look amazing but completely miss the point - it's wild how often this happens. Talk to a few power users first about their biggest headaches. Then just keep tweaking based on how they actually work, not how you think they should work.
Power BI and Tableau are the big names for FM dashboards, plus you've got specialized stuff like IBM TRIRIGA or Archibus. But honestly? Most teams I know still use Excel for half their reporting because everyone gets it and it's super flexible. Not sexy, but whatever works. You'll probably need Azure or AWS too for pulling data from your CMMS and IoT sensors - that integration piece is key. My take is start with tools your team actually knows instead of going fancy right away. Even basic setups work great if your data isn't a mess.
Dude, IoT basically turns your dashboard into mission control instead of just boring reports. Live sensor data flows in - temperature, occupancy, energy, air quality, all that stuff. You'll catch problems before they explode into "why is the CEO sweating in his office again" situations. Way better than waiting for angry emails or walking around checking things manually. The dashboard just pings you when something's wonky. Honestly, the predictive maintenance alone will make you look like a wizard while saving serious cash on energy bills. Just pick a few critical spots to start with.
Start with energy consumption per square foot - that's your bread and butter for comparing buildings or tracking changes over time. HVAC performance is critical since it eats up most of your energy budget. Track temperature variance and how long equipment's running. Peak demand charges will hit your wallet hard, so monitor those too. Energy Use Intensity and utility costs per square foot are solid basics. ENERGY STAR scores are helpful if you can get them, though honestly some buildings don't qualify. Get these fundamentals down first, then you can add fancier metrics later.
You get instant insights into how your equipment's actually performing instead of just crossing your fingers and hoping nothing breaks. Watch for stuff like HVAC temps creeping up, efficiency numbers dropping, or weird energy spikes - those are your warning signs. Way better than the old "wait until it dies" approach, honestly. Focus on runtime hours and anything that's off from normal patterns. Set up alerts so your team can fix things during regular maintenance windows rather than at 2am on a weekend. Trust me, emergency repairs are expensive and nobody's happy about them.
Heat maps are clutch for space utilization and energy stuff - patterns jump out immediately. Bar charts work well for costs and maintenance tracking. Definitely throw in KPI cards for occupancy rates and work order times. Color-coding by priority saves me tons of scanning time, honestly can't work without it anymore. Line charts are solid for utility trends over time. Oh, and keep your colors consistent across everything. Don't cram too much data into one view though - your facilities people will actually use it if it's clean and scannable instead of overwhelming.
So basically everyone looks at the same data instead of that stupid game of telephone we always play with work orders. You can actually see who's doing what and get alerts when things change. No more "wait didn't Joe already handle this?" confusion. Everything's right there - progress, updates, the whole mess. Email chains become way less chaotic since it's all tracked in one spot. Honestly? Just get your team leads checking it daily first. Once they realize how much clearer everything gets, the rest will follow. Makes such a difference for avoiding those communication disasters.
Ugh, data entry mistakes are the worst - techs either forget to log stuff or everyone uses totally different formats. Your HVAC system will have completely different asset IDs than your CMMS, so you get duplicates everywhere. Sensors break and nobody notices for like a month lol. Integration between systems is honestly such a pain. Set up some validation rules that catch errors automatically, and drill your team on using the same naming style. Regular audits help too, but they're boring as hell. The training part is key though - consistency saves you tons of headaches later.
Yeah, so basically you set up different user profiles where people only see what they actually need. Your facilities director gets the big picture stuff - budget performance, space utilization, that kind of thing. Meanwhile maintenance folks see their work orders and equipment alerts. Property managers? They're all about tenant satisfaction and lease data. But here's the thing - you gotta talk to everyone first. Figure out what's actually driving them crazy day-to-day, then build dashboards that fix those specific headaches. Otherwise you're just throwing random data at people and calling it helpful.
Honestly? Go cloud if you can. The mobile access is huge when you're running between buildings - can't tell you how many times that's saved me. Sure, on-premises gives you more control over security and customization, but man, the maintenance is brutal. You'll pay way more upfront plus deal with all that server babysitting. Cloud's got lower startup costs and those predictable monthly bills. Most facilities guys I talk to have made the switch already. Only real downside is you're trusting someone else with your data. I'd say figure out your security needs first, then pull the trigger.
So you'd basically hook your dashboard up to AI models that crunch through all your historical maintenance data, occupancy patterns, that kind of thing. Then boom - you can actually forecast when your HVAC's gonna crap out or predict when you'll hit those crazy energy spikes. Honestly, it's wild how good these algorithms get at spotting stuff we totally miss. I'd start with something simple like elevator maintenance predictions first (way less overwhelming), then build from there once you see it actually working. Just make sure you're feeding it decent sensor data or it'll be garbage in, garbage out.
So compliance tracking is basically your lifeline for staying on top of regulatory stuff - fire inspections, HVAC schedules, accessibility rules, environmental regs, all that fun bureaucratic mess. The dashboard gives you alerts when deadlines are approaching and shows what's overdue. Honestly, it's way better than keeping track with spreadsheets (learned that the hard way). Set up notifications at least 30 days out so you're not panicking last minute. Nobody wants to deal with failed audits or violations - the paperwork alone is a nightmare.
-
The slides come with appealing color schemes and relevant content that helped me deliver a stunning presentation without any hassle!
-
I discovered this website through a google search, the services matched my needs perfectly and the pricing was very reasonable. I was thrilled with the product and the customer service. I will definitely use their slides again for my presentations and recommend them to other colleagues.