

Maintenance Dashboard With Work Orders




Try Before you Buy Download Free Sample Product
 Impress Your
 Audience
 100%
100% Editable
 Save Hours
 of Time


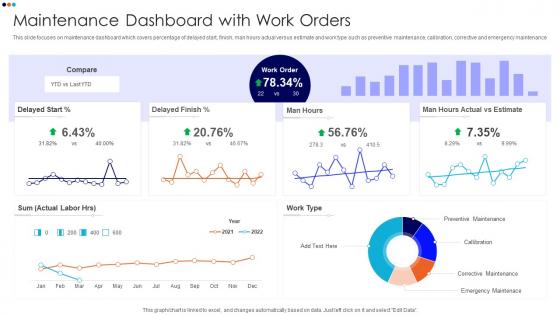
This slide focuses on maintenance dashboard which covers percentage of delayed start, finish, man hours actual versus estimate and work type such as preventive maintenance, calibration, corrective and emergency maintenance.
People who downloaded this PowerPoint presentation also viewed the following :
Maintenance Dashboard With Work Orders with all 7 slides:
Use our Maintenance Dashboard With Work Orders to effectively help you save your valuable time. They are readymade to fit into any presentation structure.





FAQs for Maintenance Dashboard
OEE, MTBF, and MTTR are your bread and butter - those three tell you almost everything you need to know about efficiency. Then add planned vs unplanned maintenance ratios, work order completion rates, and maintenance costs per asset. Equipment downtime percentage is another must-have since that's literally the first thing managers ask about every single time. Oh, and keep it simple! I made the mistake once of cramming like 15 different metrics on one dashboard and it was useless. You want something you can actually check daily without your eyes glazing over.
Honestly, just figure out what each department actually stresses about first. Manufacturing teams obsess over OEE and downtime costs - that's their bread and butter. Healthcare? They're all about compliance schedules and patient safety stuff. Most platforms let you drag widgets around pretty easily (though some are clunkier than others). Set your alert thresholds based on urgency too. Like, a ventilator failing needs instant notifications, but conveyor issues can wait for the daily report. Start with those pain points and build your dashboard views around them. Way more effective than generic templates.
You definitely want real-time data for your dashboard. Catching problems as they happen beats finding out your equipment died three days ago - trust me on that one. Instead of scrambling when stuff breaks, you'll actually see issues coming and can plan around them. Your team can focus on what matters right now instead of working off some report from last Tuesday. Honestly, the shift from "everything's on fire" to "hey, maybe we should look at that motor soon" is worth it alone. Get those live feeds running first, then build everything else on top.
So basically grab your key metrics - vibration trends, temps, runtime hours - and get those feeding into your dashboard widgets. When they hit certain thresholds, set up alerts to ping you automatically. Honestly the data can be pretty overwhelming at first, so just focus on the critical stuff. I'd put remaining useful life estimates right next to your maintenance schedules so you can see everything at once. The cool part is catching those degradation patterns before stuff actually breaks. Start with your priciest equipment first - way less painful if you mess something up there versus your cheap stuff, you know?
Honestly, just go with stuff people get instantly - traffic lights are perfect for equipment status because even the CEO knows red = broken. Bar charts show trends without drowning everyone in data. Skip pie charts though, they're weirdly confusing for quick reads. Keep your colors consistent and throw in tooltips with normal English, not tech speak. The whole point is someone should spot issues in like 30 seconds max. I learned this the hard way after watching executives squint at my first dashboard for way too long.
Just start by asking your maintenance folks what pisses them off about the current system - they won't hold back, trust me. Set up some user interviews and throw in feedback widgets right in the dashboard so people can complain in real-time. Analytics will show you which features are actually getting clicked vs. the ones everyone ignores (spoiler: there's always dead weight). Monthly check-ins with your power users before you push changes is clutch. Oh, and surveys work too if you're into that. Don't overthink it - most feedback comes from just talking to people who use the thing daily.
Honestly, the data mess is what kills most dashboards. Half your sources don't match up, the other half are missing chunks of info. Your maintenance crew will probably push back too - they're already buried in work and here you come with "exciting new technology" lol. Clean up the data first, that's non-negotiable. Then get your team involved early so they don't feel like you're forcing something on them. Show them metrics that actually make their day easier, not just pretty charts for the boss. Keep it dead simple - if they need training to read it, you've already lost.
Dude, mobile dashboards are a game changer for field teams. Your techs can pull up real-time data, update work orders, check equipment status - all from their phone instead of driving back to the office every time. Response times get way faster when people can make decisions on the spot. They can snap photos, scan QR codes, log notes instantly too, which keeps everything current. I mean, think about how clunky the old clipboard system was - this is night and day different. Get your dashboard mobile-ready and you'll see field efficiency shoot through the roof. Trust me on this one.
Power BI's probably your safest bet - most places already have Microsoft licenses anyway. Tableau's solid too if you want fancy visualizations. Both hook up to CMMS data pretty easily for real-time KPIs like MTTR and asset health stuff. Grafana's awesome if you're more on the technical side (my personal favorite honestly). Just don't get trapped doing manual spreadsheet updates - that's a nightmare. Whatever you pick, make sure it actually talks to your maintenance software first. I'd start simple with basic KPIs, then add more bells and whistles once you see what your team actually looks at.
So your maintenance dashboard basically takes all those random repair records and turns them into something you can actually use. You'll start seeing which machines break down constantly, when stuff's likely to fail next, and whether your preventive work is doing anything. Way better than digging through endless spreadsheets - trust me on that one. The visual setup makes patterns obvious right away. I'd focus on your most expensive failures first and figure out how to stop them before they happen. It's like having a heads up instead of just reacting to disasters.
Honestly, skip the PowerPoint thing and just let them mess around with the actual dashboard while you're there to answer questions. Way more effective. Teach them what the metrics actually mean for their job - not just how to read numbers. Too many people stare at data without getting the "so what" part, you know? Show them which alerts mean "drop everything" versus "deal with it later." Check in regularly that first month because confusion spreads fast. Oh, and give them practice scenarios! Nothing worse than freezing up when something real breaks.
Honestly, a maintenance dashboard just handles all that compliance stuff you're probably doing by hand right now - and it's such a pain. It tracks your schedules and generates those audit trails automatically. Plus creates reports proving you're following safety regs. When inspectors randomly show up (because they always do at the worst times), you've got real-time records of completed work orders, equipment certs, and deadlines ready to go. Everything's documented and easy to find. I'd start by figuring out which compliance requirements hit you most often - that's where you'll save the most time.
Dude, you'll seriously see like 20-30% less downtime with a good maintenance dashboard. Real-time equipment monitoring means you catch problems before they blow up into expensive disasters. Your team can actually prioritize what needs fixing first instead of just scrambling around. Plus they're not wasting time digging through paperwork to find info - everything's right there. Parts inventory, maintenance schedules, the whole deal. I'd probably start small though, maybe pick your 5 most important machines and focus the dashboard on those first. Way better than crossing your fingers and hoping nothing breaks during your busiest week.
Honestly, dashboards are lifesavers because they translate all your boring technical stuff into pretty charts that executives can actually wrap their heads around. No more explaining why that one machine keeps dying in endless meetings. The data does the talking - shows downtime, costs, all that good stuff. Management sees your wins without bugging you for constant updates (thank god). Real-time numbers make budget requests way easier to justify too. Oh, and focus on cost savings and prevented failures when you set it up. That's crack cocaine for executives - they eat that stuff up. Works every time.
So basically IoT sensors give you real-time data on temperature, vibration, all that stuff - which means you can catch problems before your equipment actually dies on you. Way better than just waiting for things to break, you know? The whole predictive maintenance thing really works because you're making decisions based on actual conditions instead of just guessing when to service stuff. Honestly, it cuts down on those random breakdowns that always happen at the worst times. I'd start with whatever equipment would screw you over most if it failed and throw some basic sensors on those first.
-
“One of the best experiences with SlideTeam for my presentation.Everything on time, communication is efficient and price is reasonable. All good in one place.”
-
“Slides are formally built and the color theme is also very exciting. This went perfectly with my needs and saved a good amount of time.”