

Feedback process flow chart powerpoint slide





Try Before you Buy Download Free Sample Product
 Impress Your
 Audience
 100%
100% Editable
 Save Hours
 of Time


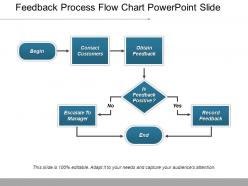
Feedback of any type is a productive element that determines the review and appraisal of any employee in an organization, the promotion or demotion of the employee in any company or candidate in any organization. The feedback process flow chart PowerPoint slide as shown here comprises of a flowchart design where the steps begin, contact customers, obtain feedback, feedback type- yes or no and then escalate to the manager if it is no and records it if it is yes, and finally end of it. Depending on the process with which it is associated, the feedback review system determines the end result. In the given case it is more of customer feedback PowerPoint presentation graphic. The entire flowchart has been designed in a very neat and clean manner. Ski along safely on our Feedback Process Flow Chart Powerpoint Slide. Conquer the steepest inclines with ease.
People who downloaded this PowerPoint presentation also viewed the following :
Feedback process flow chart powerpoint slide with all 5 slides:
Encourage folks to focus on areas of agreement with our Feedback Process Flow Chart Powerpoint Slide. It helps to get the deal going.
FAQs for Feedback process flow
So basically you collect feedback first, then sort through it all to find the patterns. Prioritizing comes next - honestly this part's a nightmare because everything seems super urgent. Teams always get stuck here. After that you make action plans, roll out the changes, and here's the thing people forget: you HAVE to circle back to whoever gave the feedback. Like, actually tell them what you did with their input. Otherwise they'll just stop bothering to help you out. People hate feeling like their thoughts disappeared into some void, you know?
Honestly, think of it like creating a roadmap so your team stops fumbling around when feedback time comes. You map out who's involved, what steps to follow, timing - all that stuff. Makes it feel less personal too, more like standard business procedure. People get way more comfortable when there's a clear process instead of just winging it. Issues don't get buried as much because everyone knows the drill for raising concerns. I'd start by looking at whatever messy system you have now (we've all been there) then build something that actually fits how your team works.
Honestly, there's a bunch of good options depending on what you need. Lucidchart is solid - really clean interface and great if others need to jump in and edit. Miro's another favorite of mine, especially for brainstorming the flow before making it official. Visio works if you're already using Microsoft stuff, though it can be kind of a pain sometimes. For basic charts, Google Drawings gets the job done without any fuss. Even Canva works in a pinch. Focus on showing your decision points and feedback loops clearly. I'd just start with whatever feels comfortable - you can always switch tools later once you figure out exactly what you want.
So every industry tweaks feedback loops differently based on what they actually need. Healthcare does super quick cycles because, well, people's lives are on the line. Manufacturing builds in checkpoints at each stage of production. Tech companies are obsessed with their sprint reviews (surprise, surprise). Retail tracks customer moods seasonally since that's when buying patterns shift. The basic cycle stays the same - collect info, analyze it, act on it, then follow up. You just need to figure out who gives feedback, who receives it, and how fast decisions need to happen in your specific setup.
Biggest mistake? Making it way too complicated - people's eyes just glaze over with too many branches. Be super specific instead of vague stuff like "review appropriately." Say "manager responds in 48 hours" or whatever. Oh, and definitely map out what happens when things go wrong, not just the perfect scenario. I swear, half the flowcharts I see completely ignore failure points! Test it with real people first too. Nobody thinks about that part. Keep it simple, spell out who's doing what exactly, and build in ways to actually improve the process later.
So basically you need arrows that loop back to earlier steps when feedback happens. I always put little feedback boxes right after the big process stages - then draw paths showing how input goes back to fix earlier stuff. Oh and use different colored arrows for feedback, otherwise it gets messy real quick (learned that the hard way lol). The key is keeping it clean without making your diagram look like spaghetti. Honestly just focus on your 2-3 biggest feedback moments first, then add the loops there. You can always build out more later.
Start with color coding - green for positive feedback, red for escalations, that kind of thing. Bold arrows are your friend, and use solid vs dotted lines to show main paths versus backup routes. Icons really help too, especially at decision points. Oh, and please don't make those text boxes all wonky sizes - keep them consistent! I always sketch mine on paper first because I'm old school like that. White space is clutch. Honestly, half the flowcharts I see look like someone threw spaghetti at a wall. You don't want that mess.
So basically track the main stuff - response rates, how long things take to fix, and satisfaction scores. Watch for where people bail out or get stuck because honestly, those bottlenecks will torpedo your whole system. I learned that one the hard way lol. The real question is whether feedback actually creates change - that's what separates good processes from theater. Dashboards help if you can automate completion rates and timing. But here's the thing: don't go crazy measuring everything. Pick 3-4 metrics that actually align with what you're trying to accomplish. Start basic, then layer on complexity once you spot the patterns.
Think of feedback loops as turning your process into something that actually learns. Right now you're probably just documenting stuff after it happens, which is pretty useless honestly. What you want is to grab data at key moments, figure out what's working (or totally failing), then push those insights back to earlier steps. It's more like having a real conversation with your process instead of barking orders at it. Once you start closing those loops consistently - that's where the good stuff happens. You'll spot patterns and make smart changes rather than just throwing random fixes at problems.
So basically just map out who needs to review what and when - like a flowchart but actually useful. Start by writing down your current hot mess of a process first (trust me, seeing it on paper is enlightening). Then figure out the handoffs and what "approved" actually means at each step. Marketing won't be sitting around waiting for product while engineering's still confused about legal stuff. Oh, and definitely have backup reviewers for when people inevitably go on vacation. The visual really helps everyone see how they fit in instead of just flying blind.
Check your feedback flow chart every quarter, or honestly whenever things start feeling clunky. Map out what's actually happening vs what your chart says - I guarantee they're different! Talk to the people who actually use it daily, not just whoever designed it. Find those steps that always trip people up. Then update the chart to match reality and pick maybe 1-2 things to improve. Don't go crazy trying to fix everything at once - that never works. Write down the changes and tell your team clearly, or they'll just keep doing the old way forever out of habit.
Honestly, if stakeholders aren't bought in, you're basically screwed from day one. The whole thing falls apart when people don't actually use the system or think their feedback just disappears into a void. I've watched countless feedback processes get ignored because leadership wasn't really committed to acting on anything. Here's what actually works: get your key players involved in building the flowchart itself. When they help design it, they'll actually care about making it succeed. People need to see their input matters - otherwise why would they bother participating? That ownership piece is huge for getting real adoption instead of just another process everyone rolls their eyes at.
Honestly, a feedback flowchart is a game-changer for remote teams. It shows everyone exactly who reviews what and when stuff needs to happen. Remote feedback can get messy fast - people forget deadlines, unclear on who's supposed to weigh in, the usual chaos. The visual workflow fixes all that. Everyone sees their role upfront: reviewer, final decision person, or just someone who needs updates. You can stick it right in whatever project tool you're using. I'd start by writing down your current feedback mess (we all have one) then turn it into something that actually makes sense visually.
Get super specific with your feedback questions - skip the vague "how was your experience" stuff and ask something actionable like "what would make you recommend us to a friend?" Then actually do something with the responses. I learned this the hard way, but you've got to assign owners to each piece of feedback and set deadlines for fixes. Track everything in a simple spreadsheet - which feedback, what changes you made, did it help? Honestly, most people collect feedback then let it sit there. Don't be those people. Check your impact monthly and treat responses like actual project requirements.
Okay so consent is huge - be crystal clear if it's anonymous or not. Don't let people find out later their boss saw exactly what they said about him, you know? Your flowchart shouldn't pressure anyone into participating either. I've watched so many "feedback systems" turn into straight-up fishing for compliments - super annoying. Make sure folks know what happens to their responses afterward. Who gets to see what? Short version: people need to feel safe being brutally honest, not worried they're about to get burned.
-
Best Representation of topics, really appreciable.
-
Awesomely designed templates, Easy to understand.