


Financial Planning And Analysis Best Practices Powerpoint Presentation Slides




Try Before you Buy Download Free Sample Product
 Impress Your
 Audience
 100%
100% Editable
 Save Hours
 of Time


Over the last few years, CFOs are being asked to provide relevant business insights to executive level managers for quick decision making. Thats where our financial planning and analysis presentation comes into play and will assist the businesses in monitoring the organizations overall financial health and provide accurate advice to business leaders. Grab our professionally designed Financial Planning and Analysis Best Practices PowerPoint presentation, which covers sections such as introduction to financial planning and defining the capabilities of the financial planning and analysis team. Afterward, the deck caters to a section through which managers can select the best financial planning and analysis software tool for reporting and forecasting. The PPT also covers a section of the financial analysis course which will assist the employees in analyzing the balance sheet and assessing the financial position. Furthermore, the module includes a section on the development and execution of a contingency plan which can be used to overcome financial risks. Going forward, the company can monitor its financial health using various tools such as financial statements and accounting ratios. At last, it covers a few dashboards which will allow the finance and accounting teams to track the organizations revenue and profitability. Get access now
People who downloaded this PowerPoint presentation also viewed the following :
Content of this Powerpoint Presentation
Slide 1: This slide introduces Financial Planning and Analysis Best Practices. State your company name and begin.
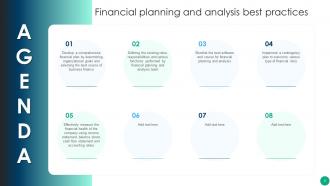
Slide 2: This slide states Agenda of the presentation.
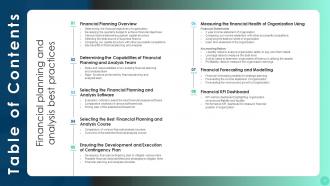
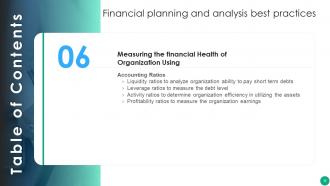
Slide 3: This slide shows Table of Content for the presentation.
Slide 4: This slide highlights title for topics that are to be covered next in the template.
Slide 5: The following slide outlines the primary and secondary financial objectives of company.
Slide 6: The following slide outlines a projected budget plan for the company.
Slide 7: The following slide outlines different factors which can be used to select the optimal capital structure for the organization.
Slide 8: The following slide outlines various sources of finance which will assist the organization to expand their operations.
Slide 9: The following slide outlines the comparison of the company capital structure with other competitors in the industry.
Slide 10: The following slide outlines multiple advantages of financial planning and analysis.
Slide 11: This slide exhibit table of content- Determining the Capabilities of Financial Planning and Analysis Team.
Slide 12: The following slide outlines different roles and responsibilities of the organization existing FP&A professionals.
Slide 13: The following slide outlines key functions performed by FP&A professionals.
Slide 14: This slide highlights title for topics that are to be covered next in the template.
Slide 15: The following slide outlines the various factors which will assist the organization in determining the financial analysis software tool.
Slide 16: The following slide outlines comparative assessment of different financial analysis software tools.
Slide 17: The following slide outlines the pricing plan of financial analysis software.
Slide 18: This slide highlights title for topics that are to be covered next in the template.
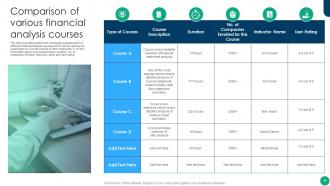
Slide 19: The following slide outlines the comparative assessment of different financial analysis courses.
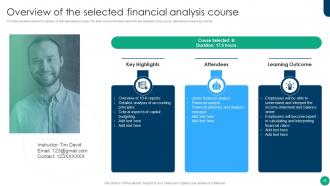
Slide 20: The following slide outlines the glimpse of financial analysis course.
Slide 21: This slide highlights title for topics that are to be covered next in the template.
Slide 22: The following slide outlines a contingency plan which will assist the company to overcome financial crisis.
Slide 23: The following slide outlines a contingency plan through which businesses can overcome various kind of risks.
Slide 24: The following slide outlines different strategies which can be deployed to overcome financial risks.
Slide 25: The following slide outlines strategies which can be effectively utilized to reduce financial risks.
Slide 26: The following slide outlines a comprehensive checklist which can be used to develop a strategic plan.
Slide 27: This slide highlights title for topics that are to be covered next in the template.
Slide 28: The following slide outlines company’s core financial statement for the period of last 3 years.
Slide 29: The following slide outlines a comparison of organization financial statement with various competitors.
Slide 30: The following slide outlines 3 years statement of financial position of the firm.
Slide 31: The following slide outlines a comprehensive statement of cash flows.
Slide 32: This slide highlights title for topics that are to be covered next in the template.
Slide 33: The following slide outlines different liquidity ratios through which the manager can analyze the firm ability to meet short-term liabilities.
Slide 34: The following slide outlines top 2 leverage ratios which will assist the in determining the debt level incurred by the organization.
Slide 35: The following slide outlines efficiency ratios which can be used to indicate the company efficiency in utilizing the assets.
Slide 36: The following slide outlines different profitability ratios which can be used by the investors to measure the financial position of the company.
Slide 37: This slide highlights title for topics that are to be covered next in the template.
Slide 38: The following slide outlines different type of financial forecasting models.
Slide 39: The following slide outlines historical and forecasted income statement of the company.
Slide 40: The following slide outlines a comprehensive chart highlighting the estimated company revenue.
Slide 41: This slide highlights title for topics that are to be covered next in the template.
Slide 42: The following slide outlines key performance indicator (KPI) dashboard showcasing various financial metrics of the organization.
Slide 43: The following slide outlines a comprehensive key performance indicator (KPI) dashboard highlighting different financial metrics.
Slide 44: This slide contains all the icons used in this presentation.
Slide 45: This slide is titled as Additional Slides for moving forward.
Slide 46: This slide presents Various types of financial forecasting tools.
Slide 47: This is About Us slide to show company specifications etc.
Slide 48: This is Our Mission slide with related imagery and text.
Slide 49: This is Our Team slide with names and designation.
Slide 50: This is Our Goal slide. State your firm's goals here.
Slide 51: This slide shows Post It Notes. Post your important notes here.
Slide 52: This slide displays Column chart with two products comparison.
Slide 53: This slide depicts Venn diagram with text boxes.
Slide 54: This is a Timeline slide. Show data related to time intervals here.
Slide 55: This is a Thank You slide with address, contact numbers and email address.
Financial Planning And Analysis Best Practices Powerpoint Presentation Slides with all 60 slides:
Use our Financial Planning And Analysis Best Practices Powerpoint Presentation Slides to effectively help you save your valuable time. They are readymade to fit into any presentation structure.
-
Financial Planning and Analysis Best Practices
-
Financial planning and analysis best practices
-
Financial Planning and Analysis Best Practices
-
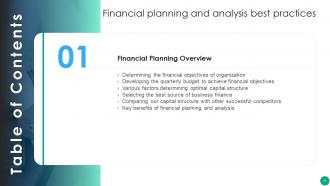
Financial planning and analysis best practices
-
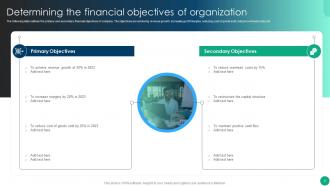
Determining the financial objectives of organization
-
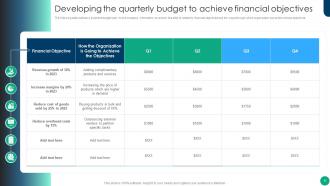
Developing the quarterly budget to achieve financial objectives
-
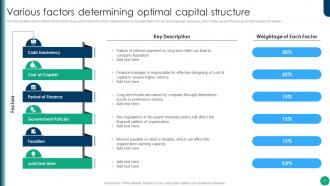
Various factors determining optimal capital structure
-
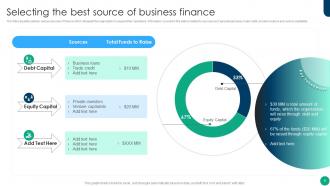
Selecting the best source of business finance
-
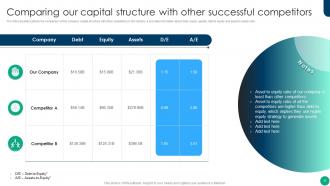
Comparing our capital structure with other successful competitors
-
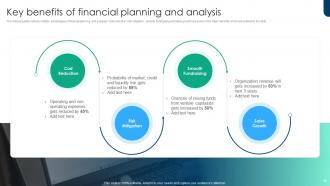
Key benefits of financial planning and analysis
-

Financial planning and analysis best practices
-
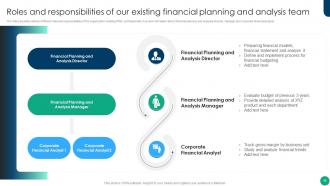
Roles and responsibilities of our existing financial planning and analysis team
-
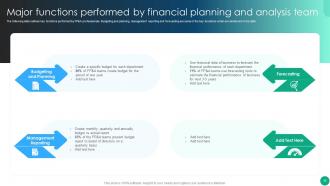
Major functions performed by financial planning and analysis team
-
Financial planning and analysis best practices
-
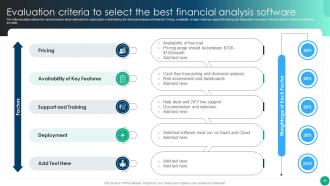
Evaluation criteria to select the best financial analysis software
-

Comparative analysis of various software tools
-
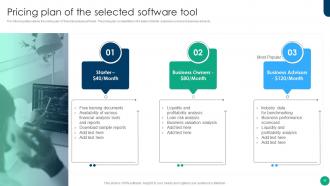
Pricing plan of the selected software tool
-
Financial planning and analysis best practices
-
Comparison of various financial analysis courses
-
Overview of the selected financial analysis course
-
Financial planning and analysis best practices
-

Developing financial contingency plan to mitigate various risks contd
-
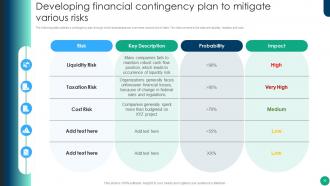
Developing financial contingency plan to mitigate various risks
-
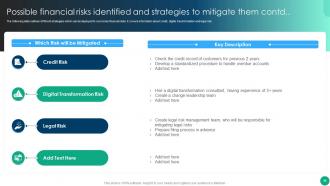
Possible financial risks identified and strategies to mitigate them contd
-
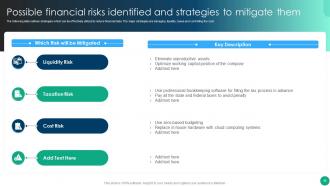
Possible financial risks identified and strategies to mitigate them
-
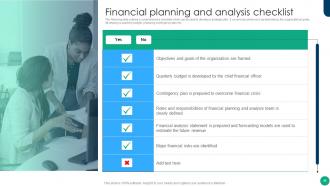
Financial planning and analysis checklist
-
Financial planning and analysis best practices
-
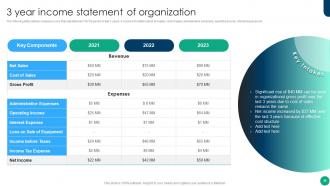
3 year income statement of organization
-
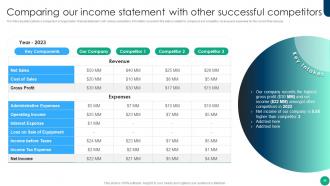
Comparing our income statement with other successful competitors
-
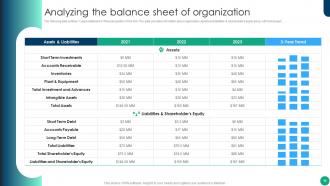
Analyzing the balance sheet of organization
-
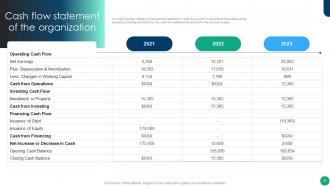
Cash flow statement of the organization
-
Financial planning and analysis best practices
-
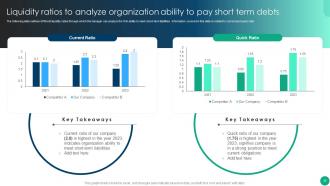
Liquidity ratios to analyze organization ability to pay short term debts
-
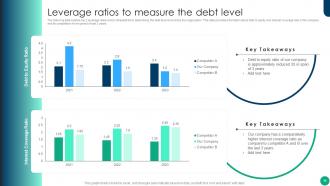
Leverage ratios to measure the debt level
-
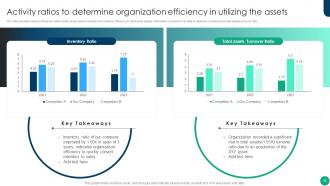
Activity ratios to determine organization efficiency in utilizing the assets
-
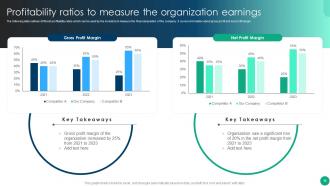
Profitability ratios to measure the organization earnings
-
Financial planning and analysis best practices
-
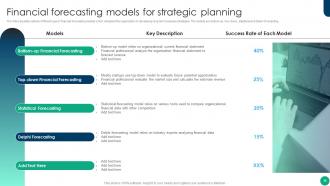
Financial forecasting models for strategic planning
-
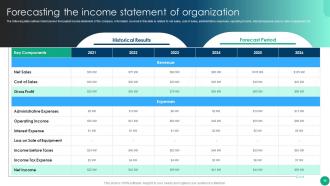
Forecasting the income statement of organization
-
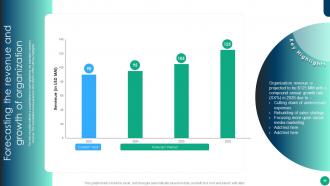
Forecasting the revenue and growth of organization
-
Financial planning and analysis best practices
-
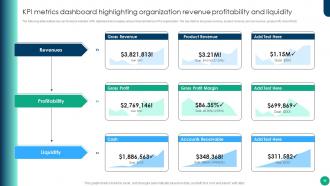
KPI metrics dashboard highlighting organization revenue profitability and liquidity
-
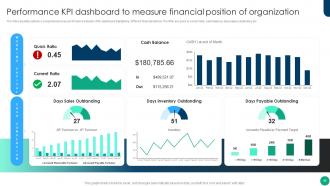
Performance KPI dashboard to measure financial position of organization
-
Icons slides for financial planning and analysis best practices
-

Additional slides
-
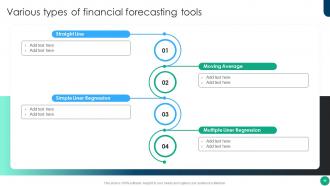
Various types of financial forecasting tools
-

About Us
-

Our mission
-

Our team
-

Our goal
-
Post it notes
-
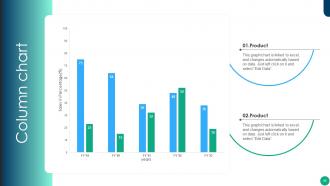
Column chart
-
Venn diagram
-
Timeline
-

Financial Planning and Analysis Best Practices
-

-

-

-

-

FAQs for Financial Planning And Analysis Best Practices
Honestly, start with the basics: budgeting, forecasting, variance analysis, and financial reporting. Build rolling forecasts that you actually update - none of those annual budgets gathering dust in some folder. When doing variance analysis, figure out WHY numbers are off, don't just point out the differences (drives me crazy when people skip this part). You need decent data management and KPI tracking too. Pick maybe 3-5 metrics that actually matter for your business and focus there first. The whole point is giving leadership stuff they can act on, not just pretty charts.
Look, FP&A basically turns your financial mess into actual useful info you can act on. You'll catch trends before they bite you and test out different scenarios without burning cash. Variance analysis shows you why numbers aren't hitting targets - honestly, this part's a game changer. Rolling forecasts keep you flexible instead of stuck with some January budget that's already outdated. Think of it like having a really good financial GPS, but with more Excel involved. Figure out your biggest decisions coming up and work backwards - what numbers would actually help you pick the right move?
Honestly, data analytics completely changes how FP&A works. Instead of just reacting to whatever happened last month, you can actually predict trends and catch issues early. The manual variance reports? Those become automatic. I'd start super small though - maybe automate your monthly budget vs actuals first. Once you see how much time that saves, you'll want to tackle everything else. Yeah, there's definitely a learning curve at the beginning, but it's worth it. You end up spending way more time on the fun stuff - figuring out what the numbers actually mean for decisions instead of just pulling endless reports.
Honestly, data quality is where you'll see the biggest impact. Get stakeholders on board from day one - trust me on this. Force everyone to use the same templates instead of letting them go rogue with their weird Excel creations (looking at you, marketing department). Rolling forecasts beat annual budgets every time. Always run best/worst case scenarios too. Track your actuals vs forecasts religiously so you can catch where you're consistently wrong. Don't try to fix everything at once though - pick one area and nail it first.
So basically, top-down is when the bosses decide the budget limits and everyone has to work within that. Bottom-up flips it - departments submit what they actually need, then it all gets rolled together. Use top-down when you need speed or strict cost control, like during a recession. Bottom-up takes forever but gives you way more buy-in from teams and realistic numbers. Honestly, most places I've seen just mix both approaches anyway. My advice? Start with the bottom-up stuff to get real operational data, then smack it with some top-down reality to make the final budget work.
So basically you build multiple versions of your financial forecast instead of just one - like best case, worst case, and realistic scenarios. Yeah, it's kinda annoying to set up at first. But you'll catch blind spots you'd totally miss otherwise. Pick 3-4 things that could really mess with your numbers (revenue changes, market shifts, whatever) and see how they'd actually affect your finances. Then you can prep for different outcomes instead of just crossing your fingers that everything goes perfectly. Honestly saves you from so much stress later.
Okay so you'll want to mix profitability stuff with liquidity and efficiency metrics. Gross margin, net profit margin, and EBITDA are your profitability basics - they show if you're actually making money on what you sell. Current ratio and cash flow from operations tell you about liquidity because being profitable but cash-broke is the worst. For efficiency, track inventory turnover, receivables turnover, and return on assets. Revenue growth rate matters too, obviously. Honestly though? Pick like 3-5 that make sense for your specific business and just track them monthly. Don't overthink it.
Dude, automation is a game-changer for FP&A work. Dashboards can pull data from all your different systems automatically, so you're not stuck doing manual data entry for hours. AI handles forecasting pretty well these days too. I'd honestly start with something simple like automating your monthly reports - once that's running smoothly, you can tackle other stuff. Cloud platforms make collaboration way easier since everyone's working off the same real-time data. My friend's team went from spending like 60% of their time on data grunt work to actually doing analysis and strategic thinking. The setup takes some effort upfront, but it's totally worth it once everything's humming along.
Start with good historical data - trust me, crappy data leads to crappy forecasts. Get other departments involved since they know stuff you don't. Rolling forecasts work way better than those yearly ones that become useless after three months. Write down your assumptions because future you will have zero memory of why you thought X would happen. Oh, and this is crucial - actually compare what you predicted to what happened. Most people skip this step, but it's literally how you get better at forecasting over time.
So FP&A is basically the financial bridge between strategy and operations. You're taking those big-picture goals and turning them into actual budgets that make sense. What I love about it is how cross-functional it gets - you're always talking to different department heads, figuring out what they need and what's realistic. Your financial models have to reflect what ops can actually pull off while still hitting strategic targets. I'd say start with regular check-ins with both the strategy folks and operations teams. That way you stay in the loop on priorities and don't build forecasts in a vacuum.
Ugh, regulations are such a pain but they'll totally mess with your forecasts if you're not ready. Compliance costs alone can blow up your budget - just look at what GDPR did to companies' data spending. I'd start tracking regulatory calendars now so you can run scenarios before stuff becomes mandatory. Build some flexibility into your models too. Your legal team probably knows what's coming down the pipeline, so maybe grab coffee with them? Way better than scrambling to redo everything last minute when new rules drop.
Start with connecting your day-to-day metrics straight to money stuff - customer acquisition costs to revenue, inventory turns to cash flow, that kind of thing. Get your finance and ops people actually talking to each other when they're setting up KPIs (I swear, half the problems come from teams never comparing notes). Build dashboards where everyone can watch operational changes hit financial numbers in real time. Oh, and do regular check-ins between departments - catches problems before they spiral. The trick is making sure every single ops metric ties back to something your executives genuinely care about financially.
Dude, rolling forecasts changed my life - update monthly instead of doing those useless annual ones. Throw in best/worst case scenarios too. Historical data shows you payment patterns, like how Jim always pays 45 days late (ugh). Track your sales pipeline changes and when people *actually* pay vs when you invoice them. Getting granular with timing is key. Oh and don't try to fix everything at once or you'll lose your mind. Pick one thing, nail it, then add more. This stuff literally saved me when everything went to hell last quarter.
Tell a story with your numbers instead of just throwing data at people. Start with the big insight first, then show the proof. Visuals should actually help - pie charts are honestly overused. Always connect back to what they should DO about it. Executives won't care about your fancy analysis if they can't figure out the next step. Here's what helps me: try explaining your main finding in just one sentence. If that's hard, you probably need to dig deeper into what the data's actually saying. The "so what" matters more than showing off your technical skills.
Excel's your bread and butter - master those pivot tables and complex formulas. SQL and Tableau are pretty much required now too, which is kinda annoying but whatever. Here's the thing though: soft skills matter more than most people think. Being able to explain your analysis to executives without losing them in spreadsheet hell? That's gold. You need solid communication and critical thinking skills. Oh, and definitely start making friends in other departments early - finance touches literally everything, so those relationships will save your butt later. Numbers are just half the job honestly.
-
A big thanks to SlideTeam! An incredible and diverse library of templates helped me with my business project presentation.
-
Wonderful ideas and visuals. I'm really pleased with the templates, which are unique and up to date.