


Financial Snapshot Powerpoint Ppt Template Bundles


Try Before you Buy Download Free Sample Product
 Impress Your
 Audience
Editable
of Time


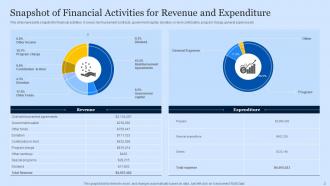
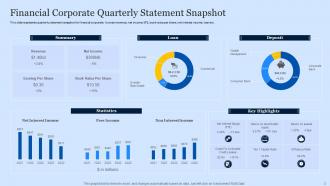
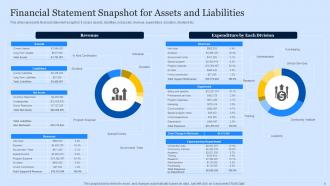
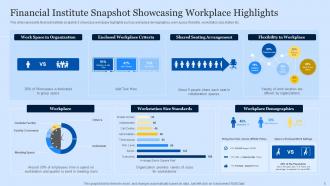
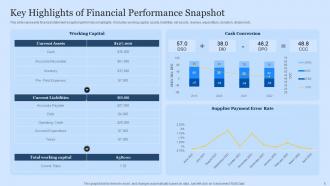
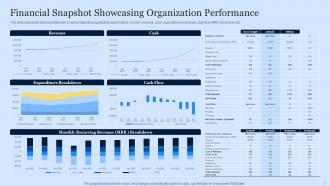
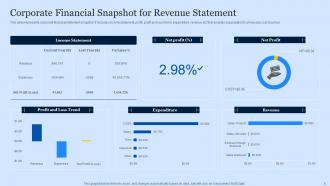
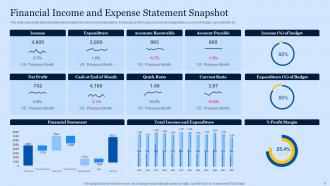
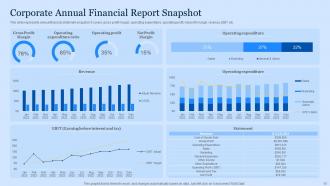
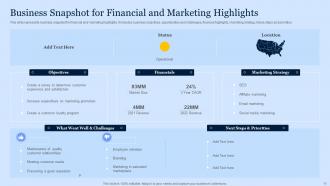
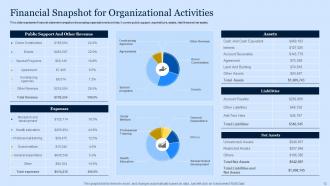
Our Financial Snapshot Powerpoint Ppt Template Bundles are topically designed to provide an attractive backdrop to any subject. Use them to look like a presentation pro.
People who downloaded this PowerPoint presentation also viewed the following :
Financial Snapshot Powerpoint Ppt Template Bundles with all 18 slides:
Use our Financial Snapshot Powerpoint Ppt Template Bundles to effectively help you save your valuable time. They are readymade to fit into any presentation structure.


FAQs for Financial Snapshot Powerpoint
So basically you need to list out your assets, debts, income, and what you spend each month. Grab your bank statements and investment stuff first - that's the heavy lifting right there. Don't stress about every little expense at first, just get the major bills down. Your mortgage, car payment, credit cards, that kind of thing. Then add your salary, side gigs, whatever money comes in regularly. It's literally like snapping a pic of your finances (that's why they call it a snapshot, I guess?). You can always go back and add the smaller details once you've got the main stuff figured out.
Honestly, weekly is ideal but monthly works fine if you're just starting out. I'd go with monthly first - gives you enough to catch problems early and spot actual trends. Weekly keeps you way more on top of cash flow stuff, which is huge. Look, I get it sounds like a pain, but old financial data is literally worthless. Better to pick a schedule and actually stick with it than be all over the place. See how monthly feels first, then bump it up if your business moves fast or you're missing important shifts between updates.
Look, cash flow is like your business's heartbeat - way more important than what most people realize. Your P&L might look amazing, but if customers are slow to pay? You're screwed. I've seen too many "profitable" companies go under because they couldn't cover payroll. It shows whether money's actually moving, not just theoretical revenue sitting there. Being rich on paper vs having real spending power - totally different things. Check it weekly, especially if you deal with seasonal stuff. Honestly, it's probably the one number that'll save your ass when things get tight.
Dude, you really need to start doing monthly financial snapshots. They'll show you exactly where your money's going and coming from right now. Cash flow problems? You'll catch them early. Which departments are killing it vs bleeding cash? Super obvious when it's all laid out. Short punchy reports work way better than those massive quarterly things nobody reads. Trust me on this one - your gut feelings about the business are probably right, but having actual numbers makes it so much easier to convince everyone else. Whether you're thinking about hiring, expanding, or just figuring out why profits are weird this quarter, these snapshots give you the real story.
Track your cash runway first - that's literally how long until you run out of money. Burn rate and revenue growth are obvious must-haves. Gross margins matter too, plus MRR if you're doing SaaS. The CAC to LTV ratio is gold for investors, honestly they eat that stuff up. Keep tabs on current cash and any big expenses coming up. Oh and funding milestones obviously. But seriously, don't go crazy - pick like 5-7 metrics tops and update monthly. Otherwise you'll drown in spreadsheets and miss the actual trends.
Honestly, charts and graphs are game-changers for financial stuff. People's eyes just glaze over when you show them spreadsheets - I mean, who has time to decode rows of numbers? Color coding works great for highlighting the important metrics. Bar charts are perfect for showing year-over-year changes, and infographics make comparisons super clear. Even simple icons help break up all that text. Makes everything way less scary, you know? The whole point is helping people get the big picture fast. I'd start with one visual per main point and see how it goes.
Honestly Excel or Google Sheets are your best bet if you want control over everything - I'm still team Excel because I'm stubborn like that lol. Mint and YNAB are solid too since they'll automatically pull from your accounts. Way less work. Personal Capital's decent for investments. Business stuff? QuickBooks is the way to go. Don't overthink it though. A basic spreadsheet beats nothing at all, and you can always upgrade later once you figure out what actually works for you.
Yeah, market conditions totally mess with your financial picture. Your investments, house value, even what you owe - it all shifts when markets get crazy. I've seen people's net worth change by like 20% in a month just from market swings alone. Interest rates screw with your borrowing costs and returns too. Plus economic uncertainty makes business values all over the place. Oh, and cash flow projections? Forget about it during volatile times. Always check the date on any financial snapshot and maybe run a few different scenarios. Markets are weird like that.
Basically, a financial snapshot shows you everything important about a company's health in one quick glance - balance sheet, cash flow, key ratios, the works. Super handy when you're comparing different investments because you don't have to dig through tons of boring reports. Red flags jump out right away, like crazy debt levels or profit margins going downhill. I honestly wish I'd started using these sooner - would've saved me from some questionable stock picks back in the day. Everything's laid out the same way so comparing Company A to Company B is actually doable. Focus on whatever metrics align with your strategy first.
Think of financial snapshots as your business report card, honestly. They help you catch which revenue streams actually make money and spot cash flow problems before they wreck you. Most of us small business owners just wing the financial stuff (I'm totally guilty of this too), but doing regular snapshots keeps you real about what's happening. Month-to-month comparisons show you seasonal patterns and growth trends. The whole point though? Actually doing something with what you learn - like if your marketing isn't working, move that money somewhere better.
Okay so the worst thing you can do is use old data - like if your numbers are from three months ago, you might as well throw the whole thing out. People love cherry-picking only the good stuff too, which is honestly just setting yourself up for disappointment later. You gotta be consistent with how you categorize everything. Those tiny random expenses? They add up way more than you think. Oh and set up some kind of regular schedule to update it - monthly works pretty well. Otherwise you're basically flying blind and your projections will be completely wrong.
Honestly, you need to know where you're starting from before you can figure out where you're going. Pull all your statements together - checking, savings, credit cards, whatever debt you've got. Once you see the full picture, setting realistic goals becomes so much easier. Plus you'll catch problems early instead of getting blindsided later. It's like... I don't know, using GPS - you can't get directions without knowing your current location, right? The whole process is way less overwhelming than people make it out to be. Just start with a basic snapshot this week.
Honestly, looking at just one month's numbers is kinda useless. When you compare multiple months, you actually see what's happening - like is your cash flow getting better or are expenses slowly eating away at everything? Maybe that great revenue month was just a fluke, you know? I always tell people to pull at least 3-6 months of data before making big moves. Otherwise you're basically flying blind. It's the difference between weighing yourself once versus tracking it daily - the pattern shows the real picture. Plus you'll know if your strategies are actually working or if it's time to switch things up.
So nonprofits are totally different - they care way more about mission impact than making money. You won't see the usual revenue/profit stuff. Instead look for program expenses, how efficient their fundraising is, donor retention rates. Their real "bottom line" is how much actually goes to the cause vs admin costs. Donors hate when too much goes to overhead, honestly can't blame them. Oh and they split funds into restricted vs unrestricted since grants usually have rules. Start with the program expense ratio when you're checking them out.
Honestly, just make sure your numbers tell a clear story. Start big picture - revenue, expenses, profit - then get into the specifics your audience actually cares about. Charts are your friend here because spreadsheets make people's eyes glaze over (learned that the hard way). Focus on trends and what's changed rather than dumping raw data on them. Always explain WHY the numbers shifted. Oh, and definitely prep for questions - have extra details ready because someone will ask. End each section with what they need to do next so you're not leaving people hanging.
-
The visual appeal of the templates is just unparalleled! I was so worried about the design of my presentation but SlideTeam made it all so easy.
-
“Excellent service from the customer support team when I wanted a slide that was a bit different from those on their standard menu. Super helpful.”