


Finance KPI Powerpoint PPT Template Bundles





Try Before you Buy Download Free Sample Product
 Impress Your
 Audience
 100%
100% Editable
 Save Hours
 of Time


Our Finance KPI Powerpoint PPT Template Bundles are topically designed to provide an attractive backdrop to any subject. Use them to look like a presentation pro.
People who downloaded this PowerPoint presentation also viewed the following :
Finance KPI Powerpoint PPT Template Bundles with all 17 slides:
Use our Finance KPI Powerpoint PPT Template Bundles to effectively help you save your valuable time. They are readymade to fit into any presentation structure.





FAQs for Finance KPI Powerpoint
Track these basics: revenue growth, gross margin, cash flow, and burn rate. Current ratio matters too - seen way too many profitable companies tank because they couldn't pay their bills. Customer acquisition cost and lifetime value are clutch if you've got recurring revenue. Honestly, don't go crazy with metrics - pick maybe 5-7 that actually matter for decisions. Monthly tracking works fine. Oh, and set up some kind of alert system when things get sketchy. Most dashboards just look pretty but don't help you run the business, you know?
Look at what actually drives revenue and costs in your industry first - that's your baseline. Most companies dump their KPIs in annual reports, so peek at competitors for ideas. Industry publications are goldmines too. Honestly? Don't overcomplicate it initially. Pick 5-7 metrics tied directly to how you make money. SaaS company? Recurring revenue and churn rates. Retail? Inventory turns and margin per square foot matter way more. The trick is choosing stuff your leadership can actually control through decisions, not just impressive-looking vanity numbers that don't move the needle.
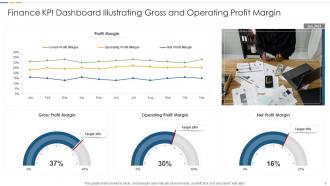
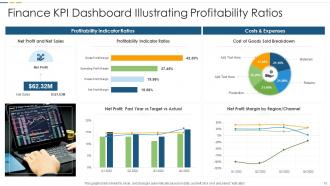
Look, profitability metrics are what actually matter when you're trying to figure out if your business works. Gross profit margin shows if you're making stuff efficiently. Your operating margin? That's whether daily operations make sense long-term. Net profit margin is the brutal truth - are you actually profitable or just kidding yourself? Honestly, I'd check these monthly because they're what everyone from investors to your bank will obsess over. Compare them to industry standards too - might be eye-opening how you stack up against competitors.
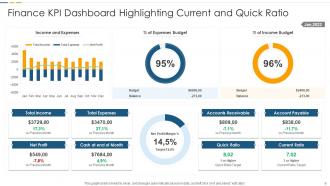
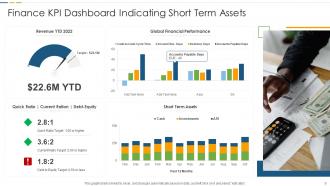
Track your current ratio and quick ratio monthly - they'll show if you can actually pay your bills without panicking. Cash ratio's good too but honestly it's pretty strict. Set targets based on what others in your industry are doing, then watch for any drops. That's your heads up that trouble might be coming. I'd throw them on a dashboard with alerts when they hit certain levels. Short bursts work better than long trends anyway. If they keep falling consistently? Time to figure out what's going wrong before you're scrambling for cash.
So basically, leading KPIs are like your crystal ball - they show what's coming (sales pipeline, customer acquisition costs, cash flow projections). Lagging ones are the scoreboard after the game's over. Revenue, profit margins, ROI - that stuff. You definitely need both though. Leading metrics let you fix things before they tank your numbers. I learned this the hard way when I only tracked revenue and couldn't figure out why it kept dropping. The trick is finding which leading indicators actually predict your results. Not all of them do, honestly.
Pick 3-5 financial KPIs that actually align with your goals - stuff like cash flow, profit margins, customer acquisition cost. Don't get lost tracking everything under the sun. Here's what most people mess up: they never compare their numbers to targets or industry benchmarks, then act shocked when the data feels useless. Monthly reviews are clutch for staying grounded. Look for patterns over time instead of obsessing over single months. When you spot trends, that's when you'll know if it's time to expand, pivot, or just keep doing what works. Honestly beats flying blind with gut feelings alone.
Stick to simple charts - one metric per slide. Bar charts work great for comparisons, line charts for trends. I swear, people always try cramming everything into one crazy dashboard and then wonder why everyone looks confused. Keep your colors consistent and use contrasting ones to highlight the important stuff. Always add context like time periods so people actually know what they're seeing. Honestly? Skip the fancy 3D effects and animations - they're just distracting from your actual data. Oh, and end each chart with a clear takeaway that connects to real business decisions. That's usually what people care about anyway.
Dude, market conditions change everything about which KPIs actually matter. When the economy tanks, you're basically in survival mode - cash flow, debt ratios, liquidity metrics become your lifeline. Growth stuff? Forget it. But when markets are hot, investors want to see revenue growth and market share expansion. I learned this the hard way a few years back. You can't just use the same dashboard metrics all year long. Update your KPIs quarterly based on what's happening around you, or you'll be tracking the wrong things entirely.
Cash conversion cycle is what you really want to watch - how fast inventory becomes actual money in your account. Also, check if you're too dependent on one big customer. I learned this the hard way when a company I was tracking lost their whale client and everything went sideways. Track employee turnover monthly too, plus R&D spending as a percentage of revenue. Days sales outstanding shows if people are actually paying you on time or just making promises. These give you way better early warnings than waiting for your P&L to tell the story.
Honestly, start with IBISWorld or RMA Annual Statement Studies - they've got solid industry averages for your size business. SCORE and BizStats have free tools too, though sometimes their data's kinda old. Don't go crazy comparing everything; just pick 3-4 key ones like gross margin, current ratio, revenue per employee. The real trick? Finding companies that match your exact industry AND size. A $500K retailer runs totally different than a $5M one, you know? I'd set up quarterly reviews to see how you're tracking. Way easier to spot trends that way.
Honestly, just start with Excel or Google Sheets if you're new to this - most people already know how to use them anyway. Once you get tired of updating everything manually (which happens fast), look into Tableau or Power BI for automated dashboards. QuickBooks works too if you're already using it. The fancy stuff like Klipfolio and Geckoboard are actually pretty cool for real-time tracking, but they cost more. Oh, and whatever you pick needs to play nice with your accounting software or you'll hate your life. Start basic, then get fancier later when you know what you actually need.
Honestly, monthly reviews work for most financial KPIs - that's what I'd stick with. Cash flow though? That needs way more attention, like daily checks. Revenue and profit stuff can wait for monthly since you need enough data to actually see patterns instead of just random fluctuations. I've watched teams drive themselves crazy checking everything daily when it doesn't even help them make better decisions. Match how often you look at the numbers to how fast you can actually do something about them. Oh and set up some kind of simple dashboard - beats frantically pulling reports every time you get nervous about the business.
Honestly, the biggest mistake is tracking way too many KPIs. You'll get buried in numbers and lose sight of what actually moves the needle. Vanity metrics are another trap - like celebrating total revenue when your margins are garbage. Also don't just steal what other companies track since their business model probably isn't yours. Make sure whatever you pick is actionable. If a KPI doesn't change how you run things, it's just noise. I'd start with maybe 3-5 financial ones that tie directly to your goals. You can always add more once those are working for you.
Honestly, financial KPIs work because they make it crystal clear what everyone's supposed to deliver. Like, when you set specific targets - revenue per employee, cost cuts, whatever - there's nowhere to hide. The numbers don't lie, right? You can track everything in real-time and actually have productive conversations about where people are falling short. Just make sure your KPIs actually connect to what the business needs (sounds obvious but you'd be surprised). Oh, and don't overwhelm people - maybe 2-3 key metrics per person max. That way they can focus instead of juggling a million different targets.
So here's the thing - financial KPIs are like the base layer that everything else builds on. Your revenue growth and profit margins? They directly mess with stuff like customer acquisition costs and how productive your team actually is. I honestly think most people miss how connected it all is. Strong financials usually mean your day-to-day operations are humming along nicely. The trick is watching both at once since financial numbers show you what already happened, but operational metrics give you hints about what's coming. Oh, and definitely figure out which operational stuff hits your core financial numbers hardest first.
-
“Immediate response, professional support, and effective solutions that were customized and immediately provided. Well done- Thank you!”
-
The team is highly dedicated and professional. They deliver their work on time and with perfection.