


Fishbone Diagram To Determine Collection Of Quality Control Templates Ppt Summary


Try Before you Buy Download Free Sample Product
 Impress Your
 Audience
Editable
of Time


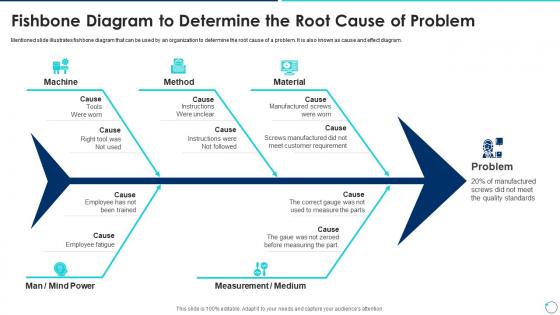
Mentioned slide illustrates fishbone diagram that can be used by an organization to determine the root cause of a problem. It is also known as cause and effect diagram.
People who downloaded this PowerPoint presentation also viewed the following :
Fishbone Diagram To Determine Collection Of Quality Control Templates Ppt Summary with all 6 slides:
Use our Fishbone Diagram To Determine Collection Of Quality Control Templates Ppt Summary to effectively help you save your valuable time. They are readymade to fit into any presentation structure.


FAQs for Fishbone Diagram To Determine Collection Of Quality Control
A Fishbone Diagram is a visual problem-solving tool that systematically maps potential causes of issues across categories like people, processes, materials, equipment, and environment. Manufacturing companies, healthcare facilities, and service organizations use this structured approach to streamline root cause analysis, enhance team collaboration during problem-solving sessions, and ultimately deliver faster resolution times while preventing recurring issues.
Fishbone Diagrams enhance team collaboration by providing structured visual frameworks that organize diverse perspectives, encourage systematic thinking, and ensure equal participation from all members. This methodology enables teams to categorize potential causes across multiple dimensions like people, processes, and materials, ultimately delivering comprehensive problem analysis and shared ownership of solutions, with many organizations finding that structured brainstorming significantly improves team engagement.
The main categories in a Fishbone Diagram typically include People, Process, Materials, Equipment, Environment, and Methods, though these can be customized based on specific analysis needs. These categories systematically organize potential root causes by operational area, enabling teams in manufacturing, healthcare, and service industries to conduct thorough problem analysis, ultimately delivering more targeted solutions and improved operational efficiency.
Fishbone Diagrams visualize all potential causes across categories like people, processes, materials, and environment simultaneously, while 5 Whys explores single cause-effect chains through sequential questioning. The fishbone approach enables comprehensive brainstorming and systematic analysis of complex problems, whereas 5 Whys delivers focused root cause identification, with many organizations finding that combining both methods enhances problem-solving effectiveness.
Fishbone diagrams are extensively utilized in manufacturing, healthcare, automotive, software development, and financial services industries. These sectors leverage this tool because it systematically identifies root causes of quality issues, operational inefficiencies, and process failures through structured analysis, ultimately enabling targeted solutions that reduce costs, minimize risks, and enhance overall performance.
Common pitfalls include rushing the brainstorming process, focusing only on obvious causes, failing to involve diverse team perspectives, creating overly complex diagrams, and stopping at symptom identification rather than root causes. Teams often overlook validating causes with data or evidence, which can lead to misguided solutions, with many organizations finding that structured facilitation and cross-functional input ultimately deliver more accurate problem analysis and effective outcomes.
Effectively facilitating a Fishbone Diagram discussion requires establishing clear ground rules, encouraging diverse perspectives from all team members, and systematically guiding the group through each cause category while maintaining focus on the root problem. Successful facilitators ask probing questions, ensure equal participation across departments, and document insights in real-time, ultimately delivering comprehensive problem analysis and enhanced team collaboration.
Data collection serves as the foundation for accurate Fishbone Diagrams by providing factual evidence to support cause identification, quantifying potential factors, and eliminating assumptions that could misdirect analysis. Through systematic data gathering, teams can validate suspected causes with measurable insights, prioritize root causes based on frequency and impact, and ensure comprehensive coverage across all categories, ultimately delivering more targeted solutions and faster problem resolution.
Fishbone Diagrams can be strategically combined with affinity diagrams for grouping related causes, flowcharts for mapping process sequences, and root cause analysis matrices for prioritization. This integrated approach enhances problem-solving accuracy by providing multiple analytical perspectives, with many organizations finding that combining these tools delivers deeper insights, streamlines investigation processes, and ultimately accelerates solution implementation.
**INPUT**: What are some best practices for presenting a Fishbone Diagram to stakeholders? **OUTPUT**: Best practices include starting with clear problem definition, organizing causes into logical categories, using collaborative input sessions, and maintaining visual clarity throughout the presentation. These approaches streamline stakeholder engagement by encouraging participation, enhancing understanding of root cause relationships, and ultimately delivering actionable insights, with many organizations finding that interactive presentations significantly improve problem-solving outcomes and team alignment.
Digital Fishbone Diagrams can be adapted through collaborative software like Miro, Lucidchart, and Microsoft Whiteboard, enabling real-time virtual brainstorming and analysis. These platforms streamline remote team collaboration by providing shared digital canvases, integrated video conferencing, and automated documentation features, with many distributed organizations finding that virtual fishbone sessions actually enhance participation and deliver faster root cause identification than traditional in-person methods.
Implementation challenges include resource constraints, timeline pressures, organizational resistance to change, inadequate stakeholder buy-in, and insufficient monitoring systems. While some root causes may require significant investment or structural changes, organizations often find that prioritizing high-impact, low-cost solutions first builds momentum and demonstrates value, ultimately enhancing team confidence and securing additional resources for comprehensive improvements.
Measuring Fishbone Diagram solution effectiveness involves tracking key performance indicators before and after implementation, conducting root cause analysis validation, and monitoring process improvements over time. Organizations across manufacturing, healthcare, and service industries typically measure success through reduced defect rates, improved cycle times, and enhanced customer satisfaction scores, with many finding that systematic measurement validates problem-solving accuracy.
Fishbone Diagram limitations in complex scenarios include oversimplification of interconnected causes, difficulty capturing non-linear relationships, potential for bias in category selection, and challenges with quantifying cause impact. While these diagrams excel at initial problem exploration, complex organizational issues often require supplementary analytical tools like statistical analysis or systems mapping, with many teams finding that combining fishbone analysis with data-driven methodologies delivers more comprehensive solutions.
Visual aesthetics significantly enhance Fishbone Diagram effectiveness by improving readability through clear fonts, consistent colors, logical spacing, and professional formatting that guides audience attention naturally. Well-designed diagrams with strategic color-coding for different cause categories, balanced proportions, and clean lines enable faster comprehension during presentations, with many organizations finding that polished visual design ultimately delivers stronger stakeholder engagement and more productive problem-solving discussions.
-
Nice and innovative design.
-
Excellent work done on template design and graphics.