

Free Key Statistics Powerpoint Template

You must be logged in to download this presentation.


Try Before you Buy Download Free Sample Product
 Impress Your
 Audience
Editable
of Time


Our Free Key Statistics Powerpoint Template are topically designed to provide an attractive backdrop to any subject. Use them to look like a presentation pro.
People who downloaded this PowerPoint presentation also viewed the following :
Free Key Statistics Powerpoint Template with all 9 slides:
Use our Free Key Statistics Powerpoint Template to effectively help you save your valuable time. They are readymade to fit into any presentation structure.


FAQs for Free Key
Look for templates with clean charts and consistent colors - cluttered data is the worst. Make sure fonts are big enough so people in back can actually see. You want templates that handle different chart types since mixing bar graphs, pie charts, and line graphs keeps things interesting. White space is your friend here. Find ones with placeholder text that shows you where to put what stats. Oh, and dashboard layouts are super helpful for highlighting key findings quickly. If you can match your brand colors, even better - though honestly that's not make-or-break.
Dude, those free stats PowerPoint templates are game-changers. Your data will actually look professional instead of like you just copy-pasted from Excel (which let's be honest, we've all done). They come with matching colors and clean layouts that make even the most boring numbers look interesting. Plus you'll save so much time - I used to spend forever trying to make charts not look terrible. The best ones guide people through your data in a logical way so they're not just staring at random graphs. Find one that works with your brand colors and drop your numbers in. Way better than starting from scratch.
Honestly, bar charts and line graphs are your best friends here. Mix in some pie charts and those trendy infographic icons with big percentages - they grab attention way better than boring spreadsheets. Data tables aren't terrible but God, they need color coding or something to not put people to sleep. Try comparison charts and trend stuff too so you're not showing the same format repeatedly. Those callout boxes with huge bold numbers work great for key metrics. Oh, and grab templates where you can just drop your data in without everything falling apart - saves so much time.
Oh man, color psychology is such a game-changer for data viz. People see red and immediately think "bad news" or urgent stuff, while green screams growth and positives. Blue's your safe bet for anything finance-related - feels trustworthy, you know? Just don't mess it up by using weird color combos that confuse people. Like, I've seen dashboards use red for good numbers just because it matched their branding... terrible idea. Your brain processes those colors way faster than the actual data, so if you pick colors that make sense intuitively, people will get your story right away.
Dude, finance and consulting teams are obsessed with these things, but really any job where you're presenting data constantly. Healthcare uses them for patient stats, tech companies for user metrics, retail for sales numbers. Oh and manufacturing too for quality stuff - basically anywhere numbers matter. The whole point is not having to rebuild the same charts every single presentation because that's honestly such a waste of time. I keep one bookmarked in my templates folder and use it way more than I thought I would. Trust me, grab one now before you need it.
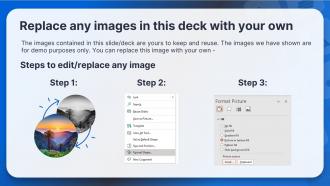
Honestly, I'd start by checking if you can easily swap out their sample data - that tells you everything about how flexible it actually is. Look for templates where you can change colors and fonts to match your stuff. The chart styles matter too since you don't want to be stuck with their weird design choices. Make sure the text boxes and image spots are moveable because rigid layouts are the worst when you're rushing to finish something. Oh, and definitely pick one with different slide options - bar charts, pie charts, timelines, whatever you might need. I learned this the hard way last month!
Honestly, animations are a game-changer for data presentations. Instead of dumping everything on screen at once, reveal your stats bit by bit so people can actually absorb what you're showing them. I learned this the hard way after watching too many eyes glaze over during my early presentations! Use simple stuff like fade-ins or slides - nothing fancy that'll distract from your point. Start with your biggest number, then build the story by animating supporting details one at a time. Trust me, it keeps people engaged way better than static slides, especially during those brutal post-lunch meetings.
Don't dump everything on one slide - your audience will just zone out. Simple charts beat fancy ones every time (trust me on this). Always explain what your numbers actually mean instead of just throwing stats around. I see people do this constantly and it drives me nuts. Make sure your data's recent and from good sources too. Oh, and here's the thing - figure out your main point first, then pick a template that fits. Don't get tempted by every cool chart type just because it looks impressive. Your charts should actually back up what you're saying.
So basically just swap out their placeholder stuff with your actual data first. Change the colors and layouts to fit whatever analysis you're doing. Bar charts bothering you? Switch them to scatter plots or trend lines - super easy with most templates. The text boxes are editable thank god, especially when you need those weird statistical terms. Oh and definitely rearrange the slide order to match your story. Maybe you need extra comparison slides, maybe fewer summary ones. I always figure out my key metrics first, then see how they fit into the template structure. Works way better that way.
Dude, you absolutely need to cite your sources or people will think you're making stuff up. Nothing's more awkward than someone asking where you got a statistic and you just... don't know. It kills your credibility instantly. Plus it shows you actually researched instead of grabbing random numbers from who-knows-where. I'd put the citations as footnotes on each slide - keeps them visible but doesn't mess with your main points. You could also do a references section at the end if you prefer. Trust me, it's way better to over-cite than get called out for sketchy data.
Honestly, PowerPoint handles the fancy animations and formatting way better than Google Slides. Your stats will look super polished in PPT. Google Slides? It tends to mess up the complex design stuff - found that out the embarrassing way during a client pitch lol. But here's the thing: Google Slides is amazing for team collaboration since everyone can jump in and edit at once. My advice? Design it first in PowerPoint to get that crisp look, then definitely test it out in Google Slides before you send it to your team. You'll catch any weird formatting breaks early that way.
Okay so font choice is actually massive for this stuff. Sans-serif fonts like Arial or Calibri work best for numbers - they're just easier to scan. I've literally watched presentations bomb because someone decided Comic Sans was perfect for their quarterly reports (like... what?). Two font families max for your template, and bump those data labels to 18pt minimum. Oh, and here's the test: can you read it from across the room? If you're squinting at your own slides, your audience definitely can't see it. Clean fonts = people actually pay attention to your data instead of getting distracted.
Ditch those text-heavy slides for visual infographics that actually tell a story. Charts and icons work way better - pie charts for percentages, bar graphs for comparisons, that sort of thing. I'm obsessed with those icon-based stats where you literally show "3 out of 5 people" using person icons. Keep your colors consistent though, and don't cram everything onto one slide (learned that the hard way). Pick your most important stats first, then hunt for infographic templates in PowerPoint that match your data types. Timeline infographics are perfect for showing trends over time too.
Honestly, visuals are your best friend here. Break those complex stats into bite-sized pieces your audience can actually digest. Define the jargon upfront too - nobody wants to feel lost. Lead with the "so what" before you get into all the methodology stuff. I've watched way too many presentations where people drone on about statistical significance and completely bury the actual insight. Charts and graphs should tell your story first. Then you can layer in technical details for the nerds who want them. Oh, and pause a lot to make sure people are still with you. Be ready to explain things differently if you're getting blank stares.
Honestly, these templates are a lifesaver for teaching stats. You'll cut your prep time in half since everything's already formatted and looks decent - no more wrestling with Excel charts that look like garbage. Students actually pay attention to the concepts instead of getting distracted by wonky formatting (which happens way too often). Most come with sample data already plugged in, so you basically just swap in your own numbers. The visual consistency thing is huge too - keeps everything clean and professional looking. Quick swap, done, and suddenly statistics doesn't feel like watching paint dry.
-
Spacious slides, just right to include text. SlideTeam has also helped us focus on the most important points that need to be highlighted for our clients.
-
My search for complete decks ended with SlideTeam. Such a surplus collection of HD PowerPoints. Moreover, their standard and widescreen formats have helped me in delivering bullseye presentations.