


Gantt chart for construction workforce health and safety training proposal ppt inspiration


Try Before you Buy Download Free Sample Product
 Impress Your
 Audience
Editable
of Time


Our Gantt Chart For Construction Workforce Health And Safety Training Proposal Ppt Inspiration are topically designed to provide an attractive backdrop to any subject. Use them to look like a presentation pro.
People who downloaded this PowerPoint presentation also viewed the following :
Content of this Powerpoint Presentation
Description:
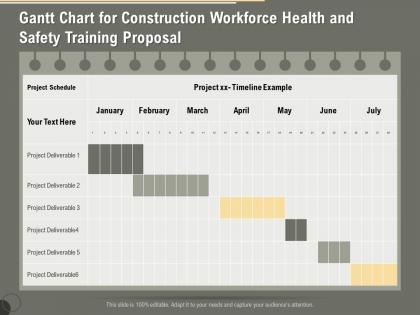
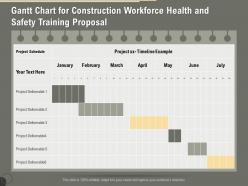
The image depicts a Gantt chart titled "Gantt Chart for Construction Workforce Health and Safety Training Proposal." A Gantt chart is a type of bar chart that illustrates a project schedule and is commonly used in project management to show when each task, referred to as "Project Deliverable," is scheduled to start and finish. In this chart, the months January through July are shown across the top, and various project deliverables are listed along the left side, each with a corresponding bar that spans across the timeline to indicate the duration of that task.
The chart is marked as "100% editable," suggesting that it can be customized to suit specific project timelines and details. Each row under "Project Deliverable" has a placeholder for text, where specific information about the deliverables can be added.
Use Cases:
Gantt charts are versatile tools that can be used across multiple industries to plan and communicate project timelines:
1. Software Development:
Use: Tracking software release milestones.
Presenter: Project Manager.
Audience: Development team, stakeholders.
2. Event Planning:
Use: Outlining event setup and execution phases.
Presenter: Event Coordinator.
Audience: Vendors, event staff.
3. Marketing:
Use: Scheduling campaign rollouts.
Presenter: Marketing Director.
Audience: Marketing team, creative department.
4. Education:
Use: Planning academic and administrative projects.
Presenter: School Administrator.
Audience: Faculty, staff.
5. Healthcare:
Use: Managing healthcare facility upgrades or implementations.
Presenter: Healthcare Project Manager.
Audience: Medical staff, hospital administration.
6. Manufacturing:
Use: Overseeing production line setup or updates.
Presenter: Plant Manager.
Audience: Production teams, engineers.
7. Government:
Use: Coordinating public sector initiatives and programs.
Presenter: Program Manager.
Audience: Government employees, policy teams.
Gantt chart for construction workforce health and safety training proposal ppt inspiration with all 2 slides:
Use our Gantt Chart For Construction Workforce Health And Safety Training Proposal Ppt Inspiration to effectively help you save your valuable time. They are readymade to fit into any presentation structure.
-
Top Quality presentations that are easily editable.
-
Much better than the original! Thanks for the quick turnaround.
-
Very well designed and informative templates.
-
Helpful product design for delivering presentation.
-
Qualitative and comprehensive slides.