

Human Resources Absenteeism And Overtime Report Dashboard




Try Before you Buy Download Free Sample Product
 Impress Your
 Audience
 100%
100% Editable
 Save Hours
 of Time


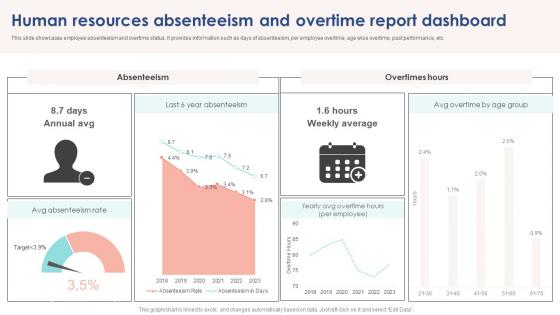
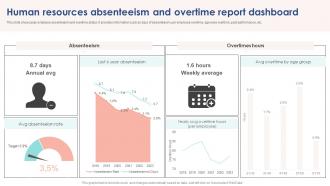
This slide showcases employee absenteeism and overtime status. It provides information such as days of absenteeism, per employee overtime, age wise overtime, past performance, etc.
People who downloaded this PowerPoint presentation also viewed the following :
Human Resources Absenteeism And Overtime Report Dashboard with all 7 slides:
Use our Human Resources Absenteeism And Overtime Report Dashboard to effectively help you save your valuable time. They are readymade to fit into any presentation structure.





FAQs for Human Resources Absenteeism And
Start with tracking your absenteeism rate and overtime hours per employee - those two are golden. Look at which departments are getting hit hardest and when people are calling out (spoiler: Mondays and Fridays are brutal). You'll also want to watch headcount vs coverage ratios and how much OT each absence creates. The real problem happens when you get stuck in this nasty loop - absences cause overtime, overtime burns people out, burnt out people call out more. Seasonal patterns matter too, honestly. Once you nail down these basics, everything else becomes way clearer.
Line charts showing monthly/quarterly trends are your best bet - way easier to spot patterns that way. Heat maps work really well for daily stuff too. Oh, and definitely break it down by department because some teams have weird seasonal spikes you'd totally miss otherwise. Color-coding by absence type is clutch - helps you figure out if it's actually health issues or just people burning vacation days. Set alerts when rates jump 15-20% above normal so you can jump on problems early. Trust me, catching this stuff before it gets out of hand saves so much headache later.
So here's the thing - engaged employees just don't skip work as much. Makes total sense when you think about it. People who actually like their jobs and feel connected to their teams want to be there. Your dashboard can show you this correlation pretty easily - just compare engagement survey scores against absence patterns. I'd bet money that teams with crappy engagement scores have way more people calling out. Those are your problem spots right there. Focus on those managers first because honestly, they're probably the root of the issue anyway.
Check your historical data for Monday absences and seasonal spikes - honestly, the patterns are pretty obvious once you look. Set alerts when rates jump above normal so you're not blindsided. The dashboard breaks things down by department and employee, which is super helpful. Oh, and definitely cross-reference with overtime hours because burned-out people call in sick way more. Use this stuff to chat with managers before you're frantically trying to cover shifts. It's wild how the data actually tells you what's coming if you pay attention to it.
Yeah, tracking absences is totally fine legally - it's more about what you do with the info that can get you in trouble. Don't single people out based on protected stuff, and be consistent across everyone. FMLA and disability absences have their own rules though, so those are tricky. Honestly, I'd get everything written down in clear policies first so employees know what's up. And definitely loop in legal before you launch any fancy dashboard - better safe than sorry when it comes to this stuff, you know?
Honestly, dashboards are clutch for this stuff. You and your boss can finally look at the same numbers instead of arguing over different spreadsheets - which happens way too often, let's be real. Real-time data shows exactly where the problems are. So instead of vague complaints like "absenteeism seems worse," you can point to concrete stuff: "Department X jumped 15% this quarter." Management sees the full picture right away. Plus you're actually solving problems together instead of just dumping issues on their desk. Makes those conversations way less awkward.
Oh nice question! First thing - connect your HRIS, payroll and time tracking systems to pull everything together. Track absence rates by department, overtime hours per person, plus what it's all costing you. Make it visual so people don't have to dig through boring spreadsheets (honestly, who has time for that?). Set up alerts when numbers get too high. Give managers access and actually show them how to use it - this part gets skipped way too often. Train your team on reading the data so they can catch patterns early and do something about it.
Automated tracking systems cut out all the manual entry mistakes that screw up attendance data. Real-time info flows straight to your dashboard from biometric scanners or mobile apps. No more buddy punching either - people can't game it anymore. You can set alerts for sketchy patterns too, like someone always calling out on Fridays (we all know that person). Everything gets timestamped automatically. Honestly, the audit trail is clutch when disputes come up because you've got solid proof of what actually happened.
Yeah, remote work usually cuts down on sick days since people can just power through minor stuff like colds or deal with family emergencies without taking the whole day off. Makes total sense, right? But here's the thing - mental health absences might actually go up because of isolation issues. Plus tracking gets weird since the line between "working from home" and "actually absent" gets pretty blurry. I'd probably look at both your usual absence numbers and productivity metrics. That way you're not missing anything important about how it's really affecting your team.
Check out the Bureau of Labor Statistics and SHRM for solid benchmarking data - most industries sit around 2-3% but manufacturing and healthcare are way higher. Industry associations also publish annual reports that are super helpful. Make sure your dashboard can filter by department and time periods so you're actually comparing similar things. The tricky part is calculating absence rates exactly the same way as whatever benchmark you're using, otherwise the comparison is useless. I'd grab 3-4 reliable industry reports and build those benchmark lines directly into your dashboard. Way easier than constantly cross-referencing separate documents.
Honestly, I'd dig into what's actually causing this first. Bad managers are usually the culprit - like, one terrible supervisor can tank an entire department's morale. Check workload balance too, some teams might be drowning while others coast. Once you figure out the real problems, you can fix them properly. Maybe it's flexible schedules, maybe redistributing work, or training those problem managers. Track engagement scores with the absence data since they're totally linked. Oh, and definitely do monthly check-ins with department heads to see if your changes are actually working.
Look at overtime patterns first - those spikes tell you where you need more staff or better workload balance. Absenteeism data is gold too. If people are calling out sick every Monday (suspicious much?), maybe you need flexible schedules or mental health support. Honestly, this beats relying on managers who always say "everything's great" when it clearly isn't. You can finally make policy changes based on real numbers instead of gut feelings. Pick your worst problem areas from the dashboard and build specific fixes around them. Way more effective than throwing random perks at people and hoping something sticks.
Honestly, it's usually burnout and stress that gets people calling in sick all the time. Job dissatisfaction too - when work sucks, people find excuses to avoid it. Employee surveys work great for tracking this stuff. Ask about workload and stress levels. Exit interviews are where people actually tell you the truth though, since they're already out the door. Look for patterns in your data - like if one team suddenly has tons of absences AND their engagement scores tank. That's when you know something's seriously wrong. Oh, and don't just look at the numbers alone. Sometimes the story's in the combo of absence rates plus survey feedback.
Dude, real-time data is a total game changer for catching absence issues. Instead of waiting weeks for reports, you'll see patterns immediately - like when half a department calls out sick. Maybe it's flu season, maybe there's drama with a manager, who knows? But you can actually do something about it right away. Set up alerts for weird spikes so you're not glued to dashboards all day. Just don't go overboard with notifications or you'll ignore them all. Honestly beats the hell out of finding out about problems after they've already screwed up your whole operation.
You'll need to learn your dashboard software plus how to actually read the data. Most HR people pick it up fast though. The tricky part isn't the tech stuff - it's figuring out what questions to ask when something looks weird. Basic Excel helps since you'll export stuff for reports. Start with just a few key metrics instead of overwhelming yourself with everything. Oh, and definitely get your IT team to walk you through it with real examples from your department. That's way better than trying to figure it out on boring sample data.
-
I came across many PowerPoint presentations with excellent creatives and I believe they would be beneficial to my work.
-
SlideTeam has helped me take my presentation to the next level. Everyone at the office is impressed! I’ll be using their designs for a long-long time.