Infrastructure Monitoring Powerpoint Presentation Slides
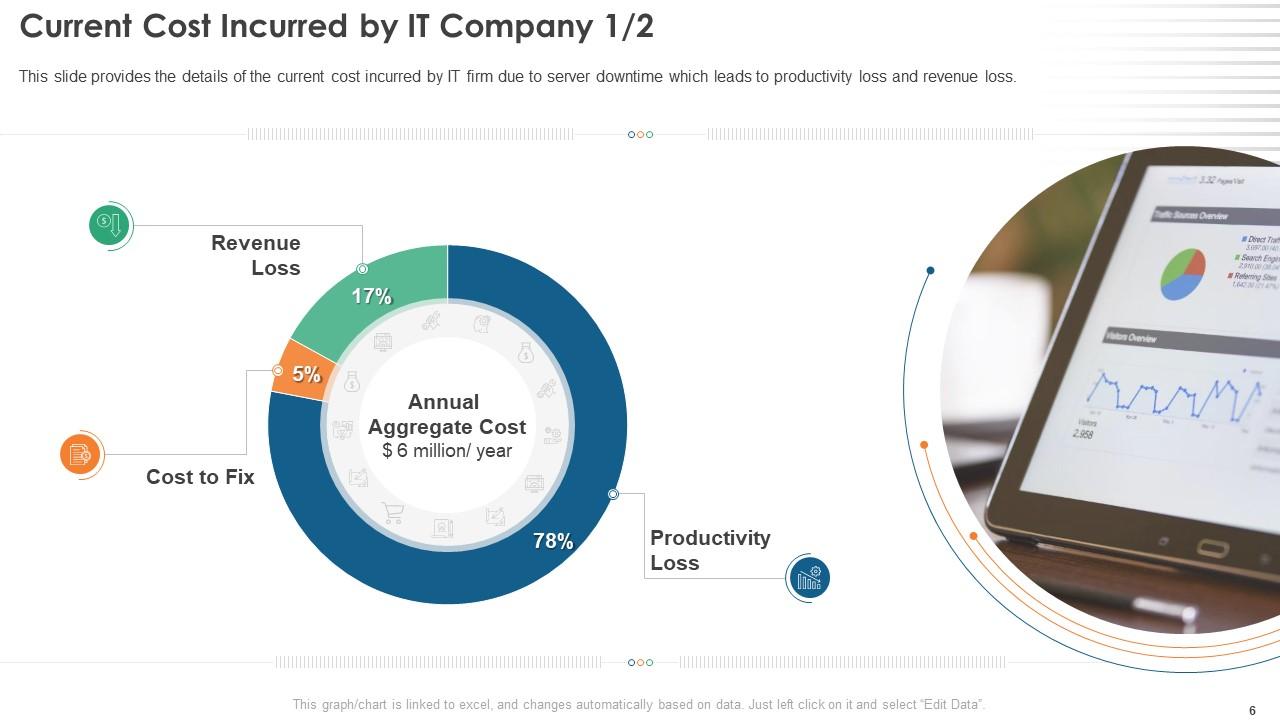
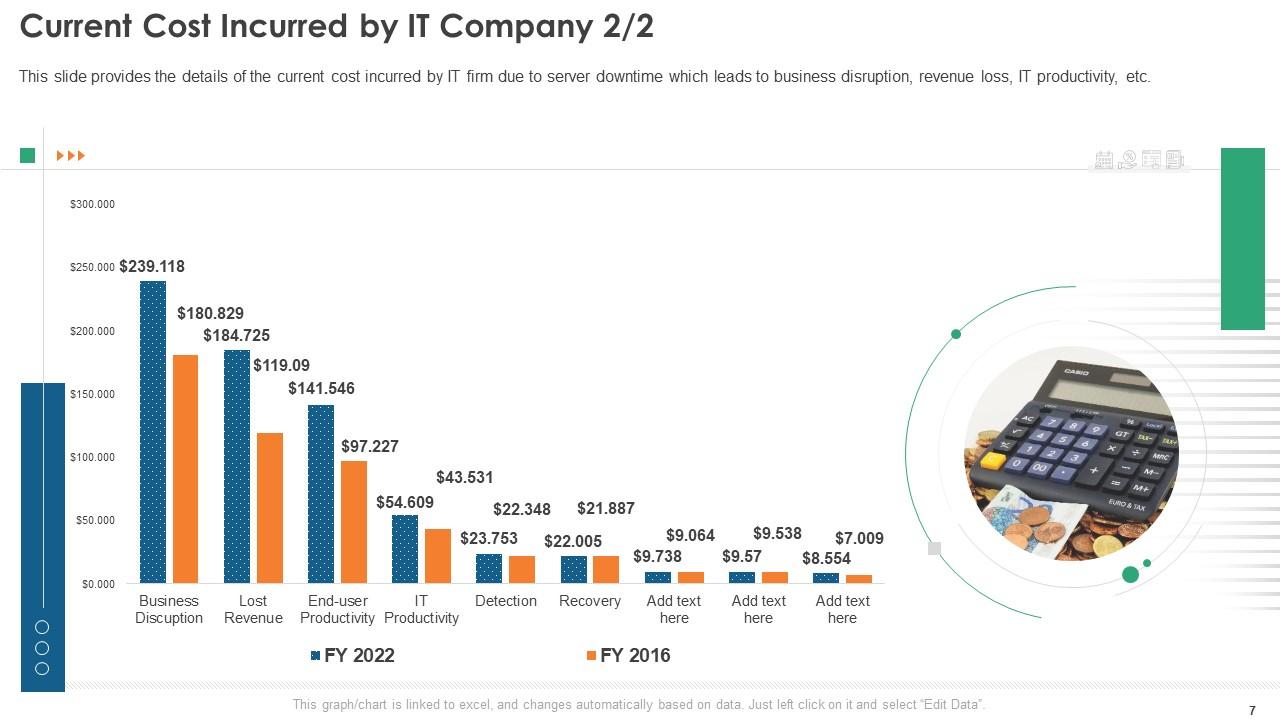
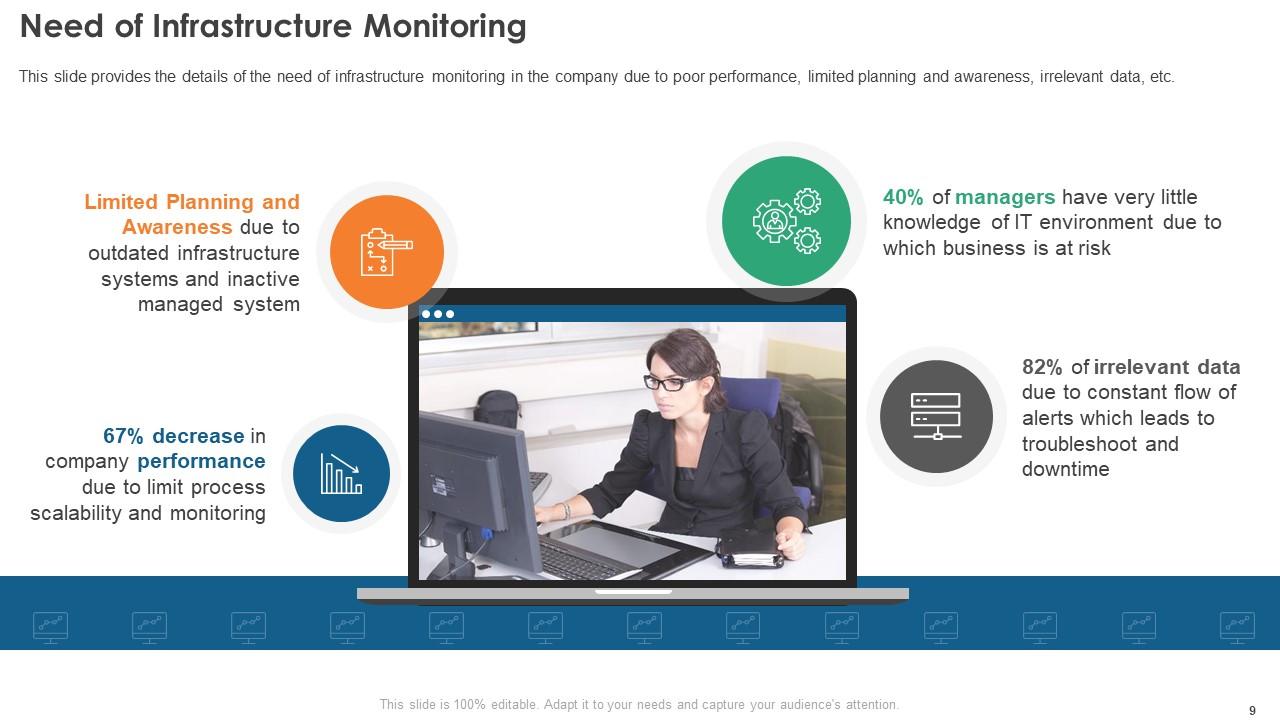
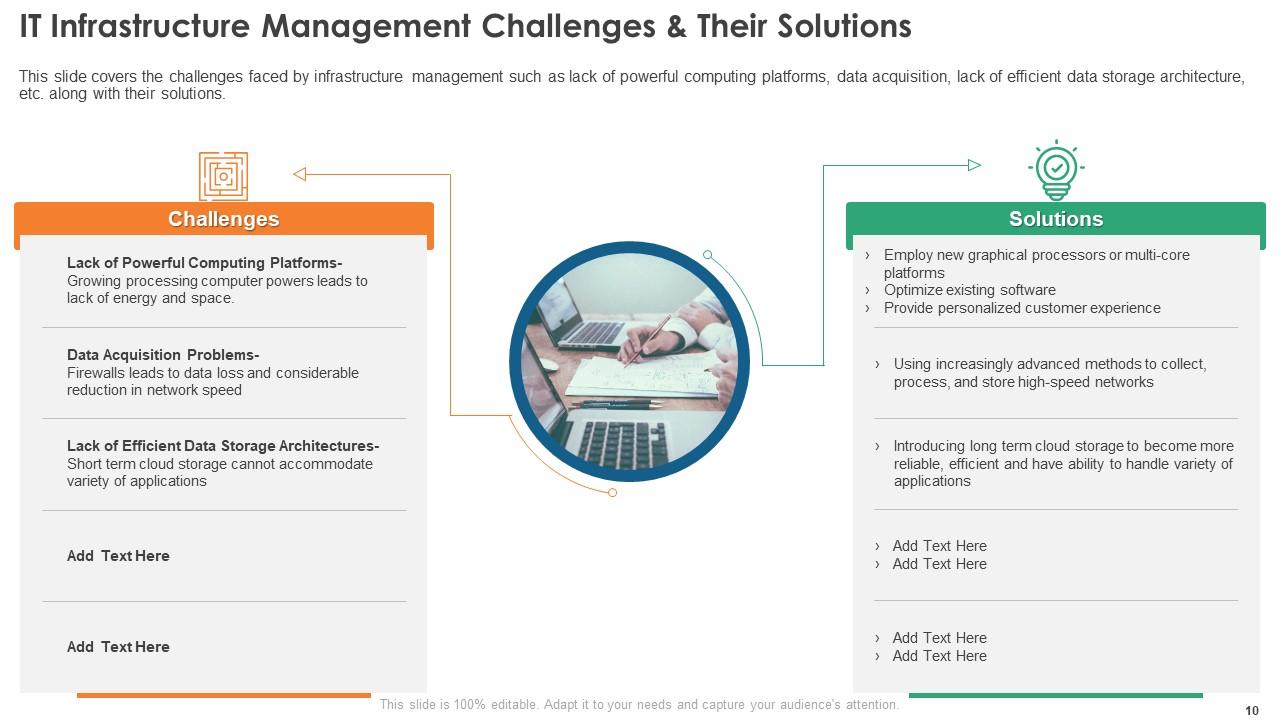
Infrastructure monitoring is the business process owned and operated by an IT organization. Check out our efficiently designed Infrastructure Monitoring template. We have evaluated the cost incurred by the company in the form of a doughnut graph and bar chart for productivity, cost to fix, revenue loss, etc. Monitoring is essential in the company due to poor performance, limited planning, awareness, irrelevant data, etc. We have focused on infrastructure managements challenges, such as the lack of powerful computing platforms, data acquisition, etc., and their solutions. This template covers the steps required for implementing IT infrastructure monitoring, such as capture, store, evaluate, interact, etc. Different types of monitoring tools and their features and services are discussed here. This slide also covers the cost and time investment needed for information technology infrastructure monitoring. Furthermore, the impact of monitoring infrastructure in the business is covered here as its future trends. Various dashboards are shared in this template which can be used for infrastructure monitoring, application server performance, etc. Get access now.
- Google Slides is a new FREE Presentation software from Google.
- All our content is 100% compatible with Google Slides.
- Just download our designs, and upload them to Google Slides and they will work automatically.
- Amaze your audience with SlideTeam and Google Slides.
-
Want Changes to This PPT Slide? Check out our Presentation Design Services
- WideScreen Aspect ratio is becoming a very popular format. When you download this product, the downloaded ZIP will contain this product in both standard and widescreen format.
-

- Some older products that we have may only be in standard format, but they can easily be converted to widescreen.
- To do this, please open the SlideTeam product in Powerpoint, and go to
- Design ( On the top bar) -> Page Setup -> and select "On-screen Show (16:9)” in the drop down for "Slides Sized for".
- The slide or theme will change to widescreen, and all graphics will adjust automatically. You can similarly convert our content to any other desired screen aspect ratio.
Compatible With Google Slides

Get This In WideScreen
You must be logged in to download this presentation.
PowerPoint presentation slides
Enthrall your audience with this Infrastructure Monitoring Powerpoint Presentation Slides. Increase your presentation threshold by deploying this well-crafted template. It acts as a great communication tool due to its well-researched content. It also contains stylized icons, graphics, visuals etc, which make it an immediate attention-grabber. Comprising fifty three slides, this complete deck is all you need to get noticed. All the slides and their content can be altered to suit your unique business setting. Not only that, other components and graphics can also be modified to add personal touches to this prefabricated set.
People who downloaded this PowerPoint presentation also viewed the following :
Content of this Powerpoint Presentation
Slide 1: This slide introduces Infrastructure Monitoring. State Your Company Name and begin.
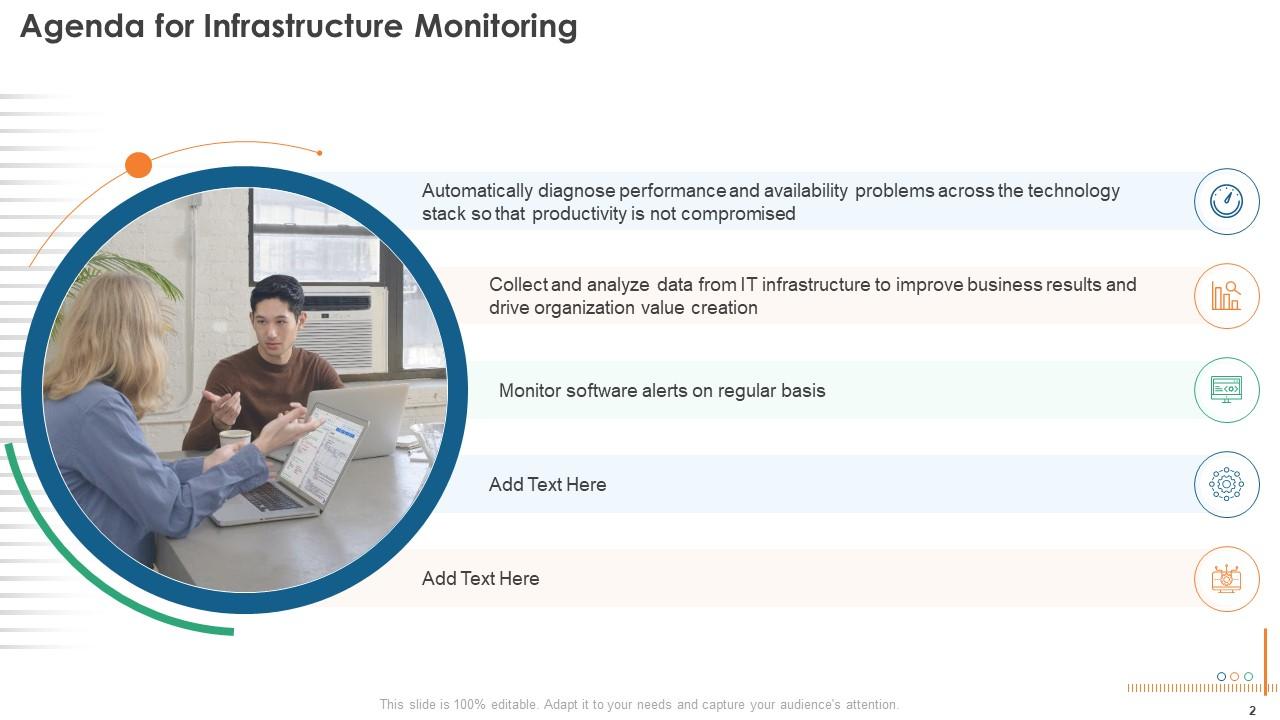
Slide 2: This slide states Agenda of the presentation.
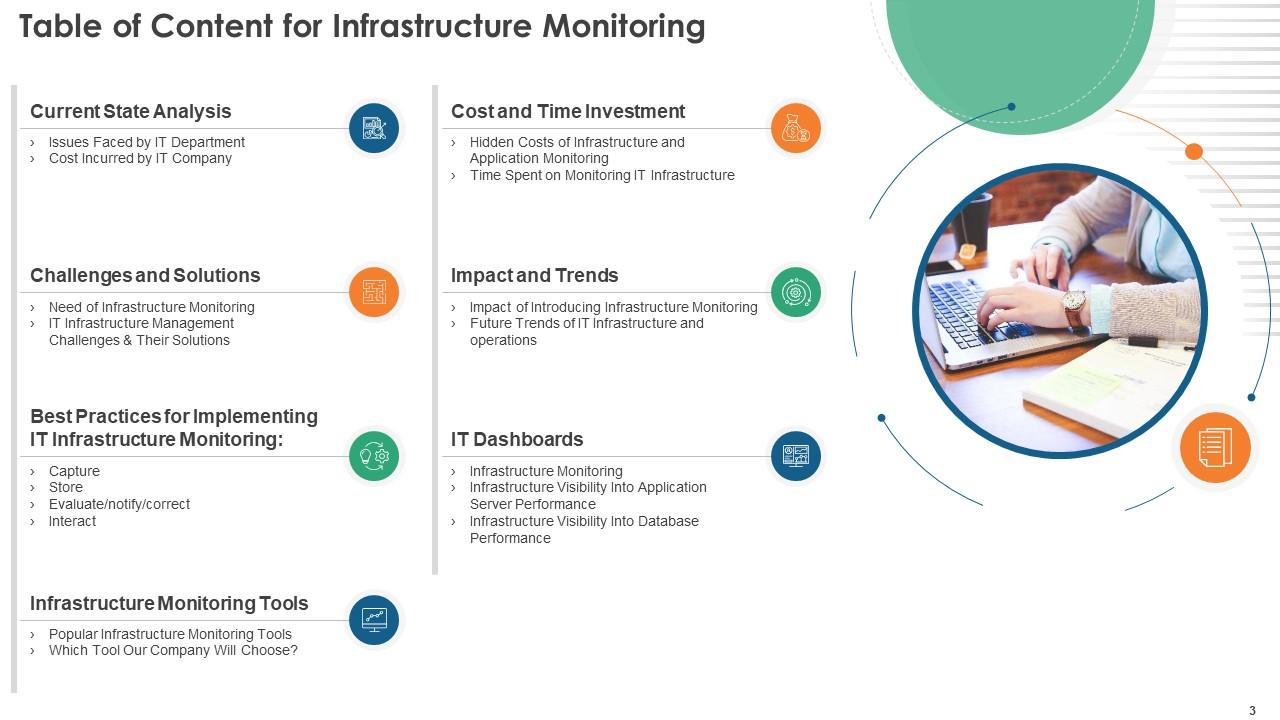
Slide 3: This slide presents Table of Content for the presentation.
Slide 4: This slide highlights title for topics that are to be covered next in the template.
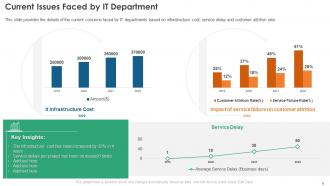
Slide 5: This slide represents Current Issues Faced by IT Department.
Slide 6: This slide displays Current Cost Incurred by IT Company.
Slide 7: This is another slide continuing Current Cost Incurred by IT Company.
Slide 8: This slide highlights title for topics that are to be covered next in the template.
Slide 9: This slide provides the details of the need of infrastructure monitoring in the company.
Slide 10: This slide presents IT Infrastructure Management Challenges & Their Solutions.
Slide 11: This slide highlights title for topics that are to be covered next in the template.
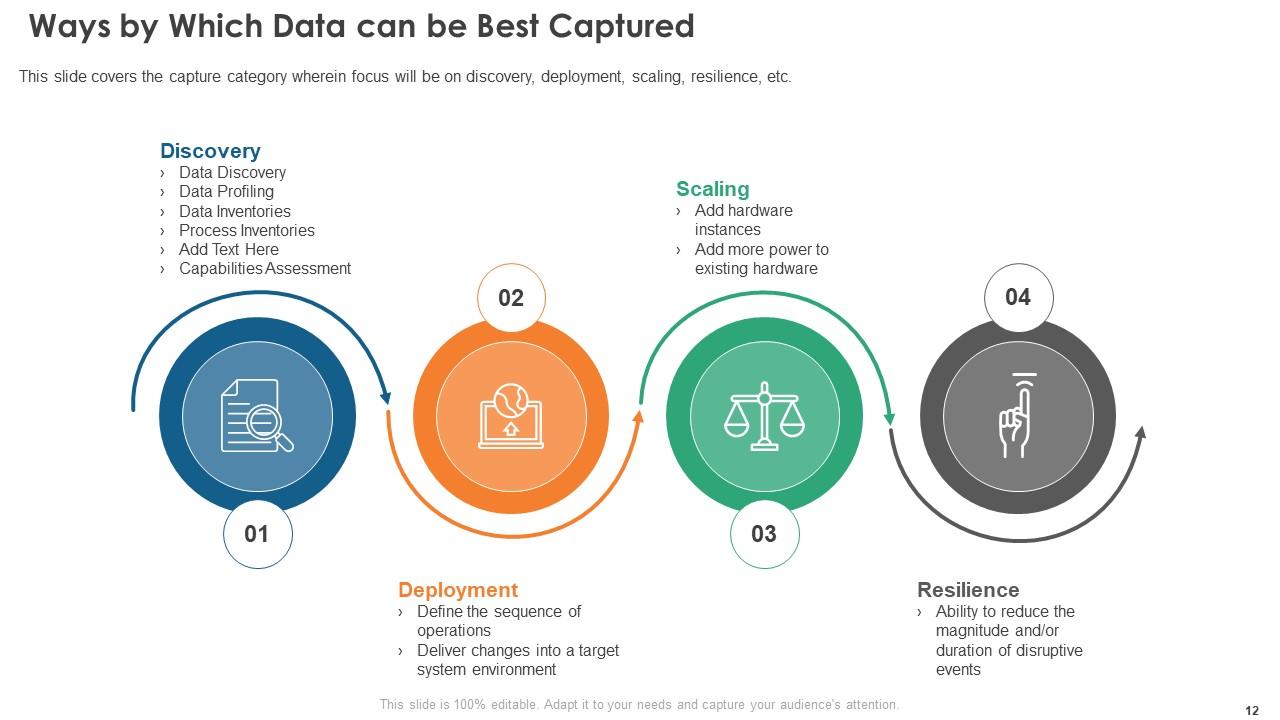
Slide 12: This slide shows Ways by Which Data can be Best Captured.
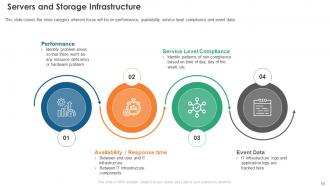
Slide 13: This slide covers the store category wherein focus will be on performance, availability, service level compliance, etc.
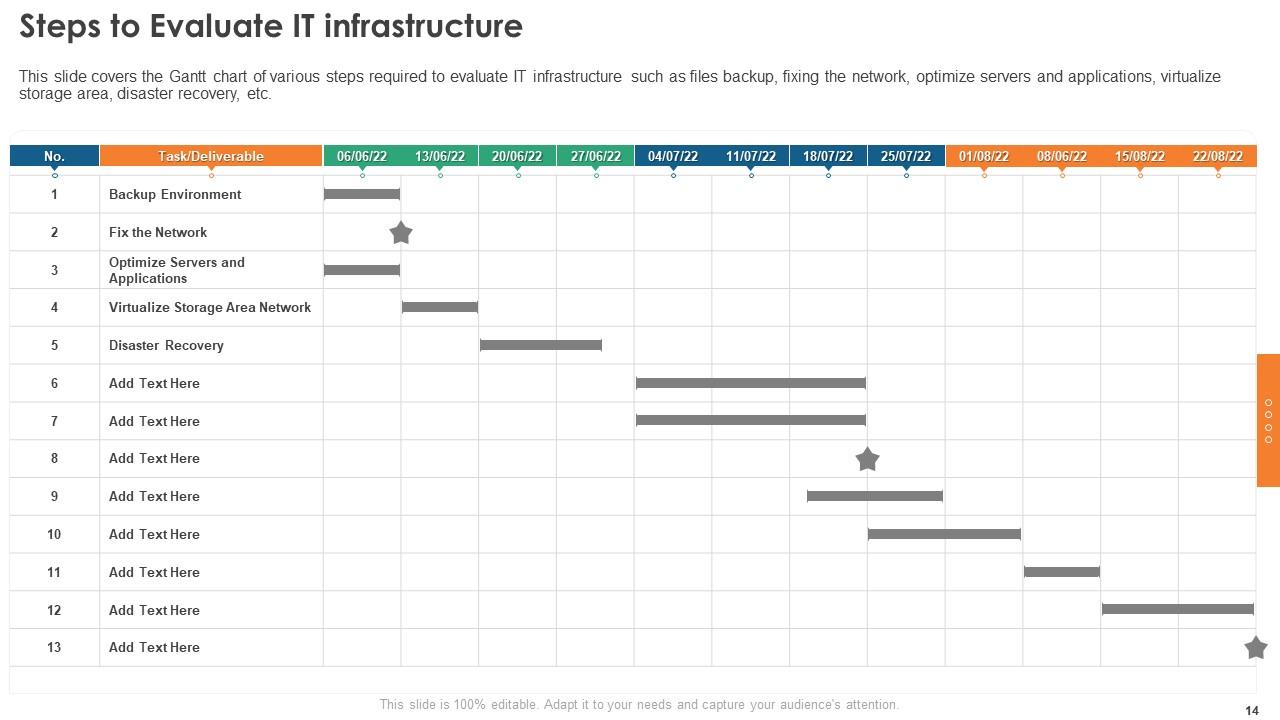
Slide 14: This slide showcases the Gantt chart of various steps required to evaluate IT infrastructure.
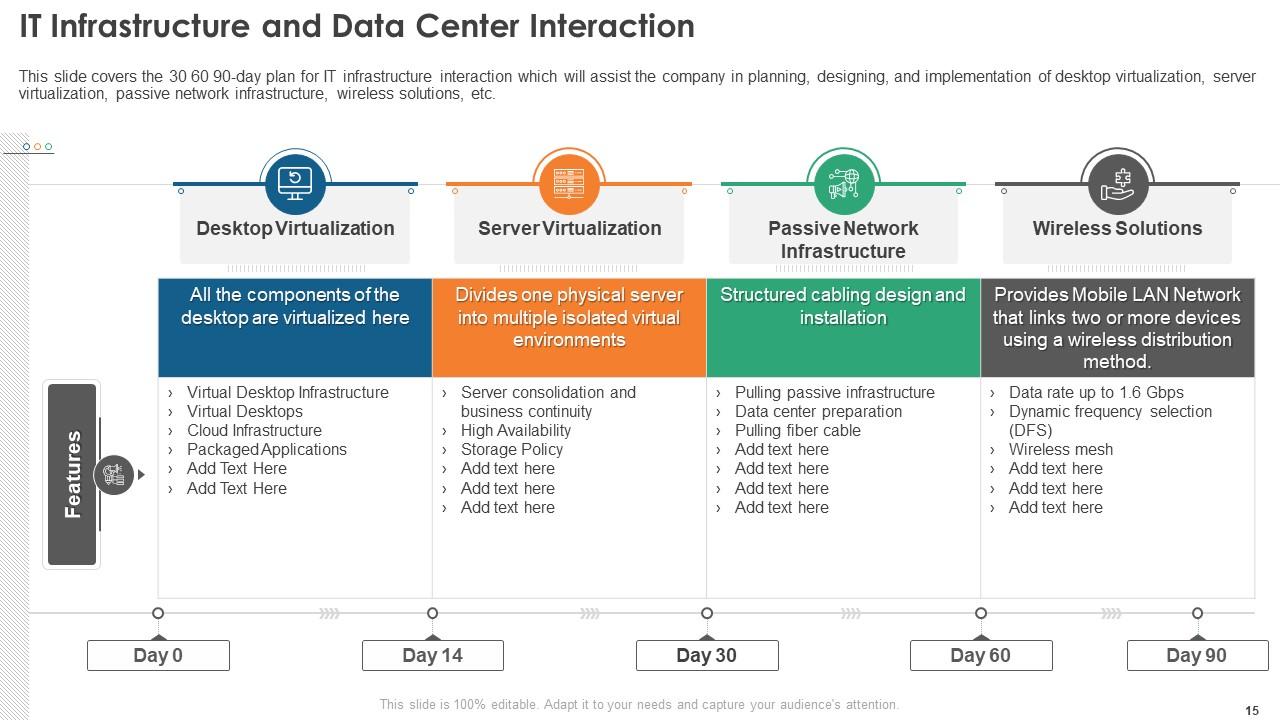
Slide 15: This slide presents IT Infrastructure and Data Center Interaction.
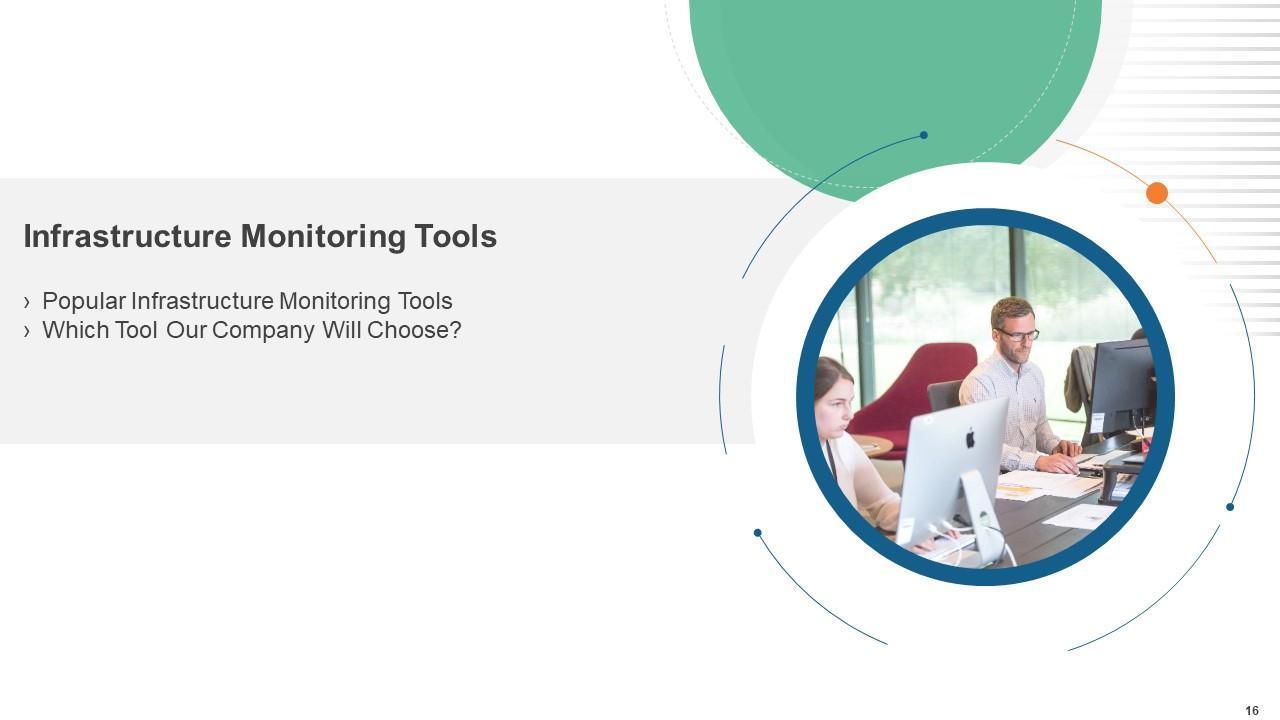
Slide 16: This slide highlights title for topics that are to be covered next in the template.
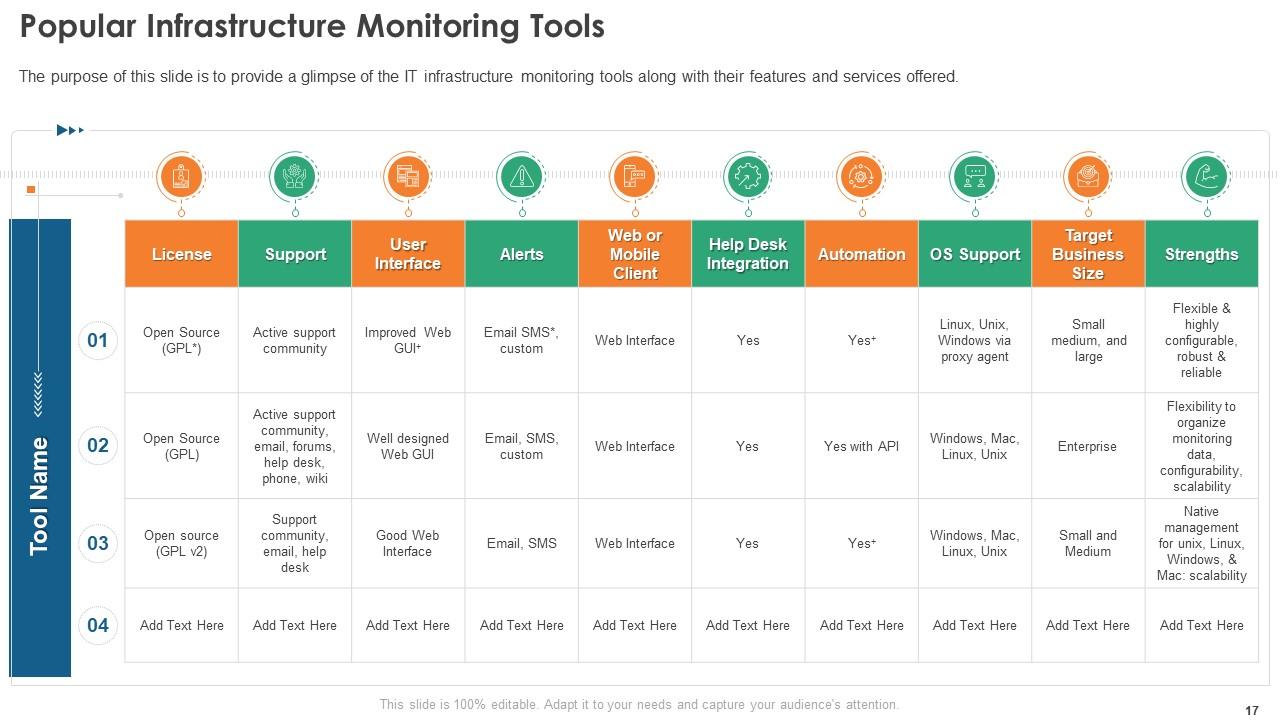
Slide 17: This slide displays Popular Infrastructure Monitoring Tools.
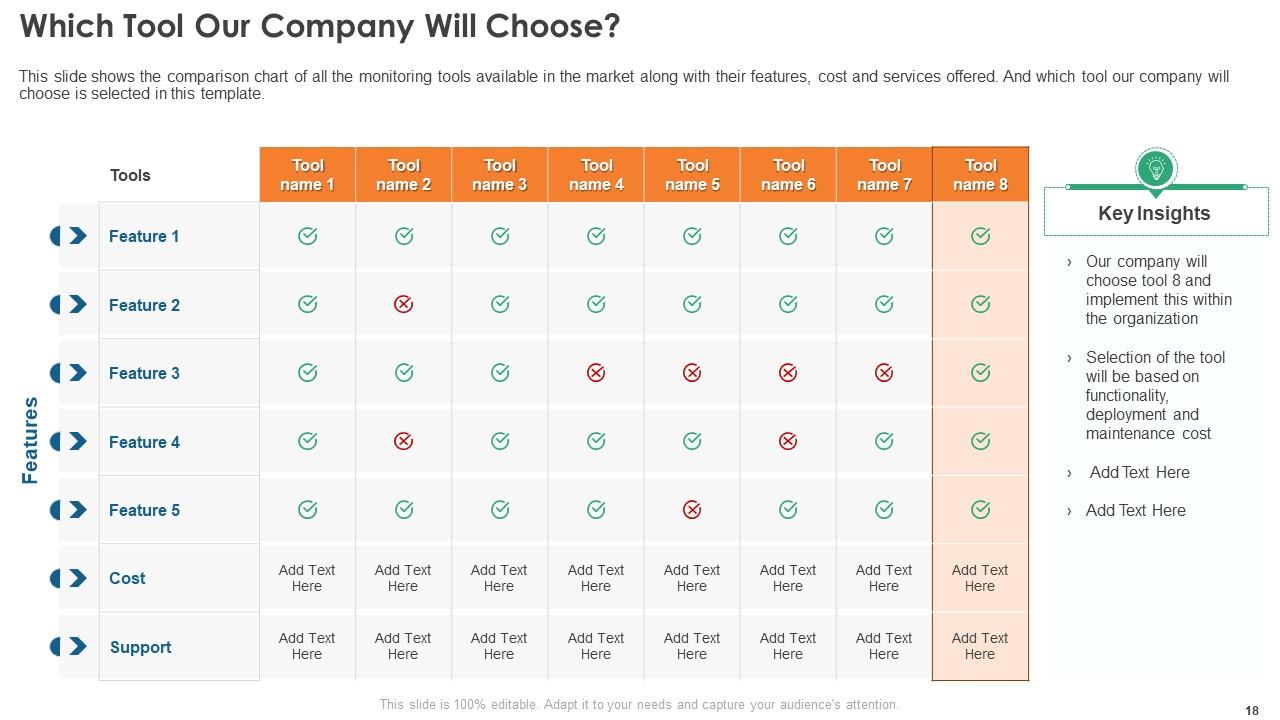
Slide 18: This slide shows the comparison chart of all the monitoring tools available in the market.
Slide 19: This slide highlights title for topics that are to be covered next in the template.
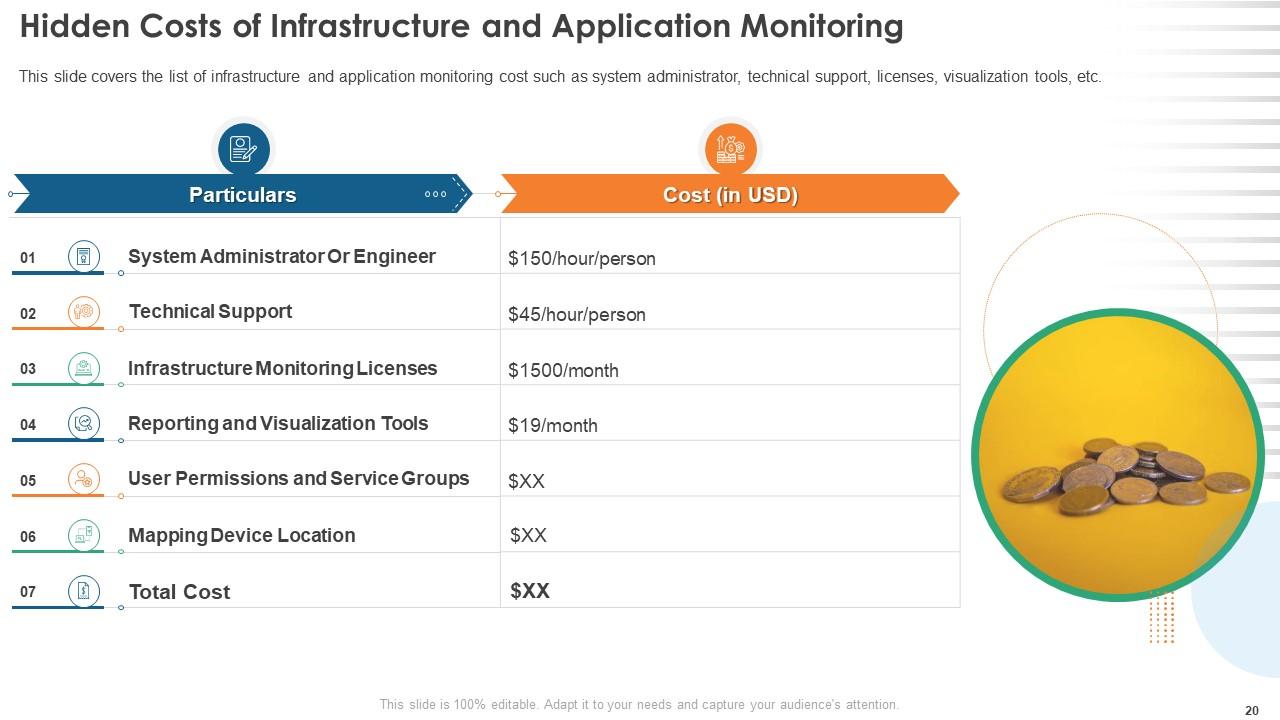
Slide 20: This slide presents Hidden Costs of Infrastructure and Application Monitoring.
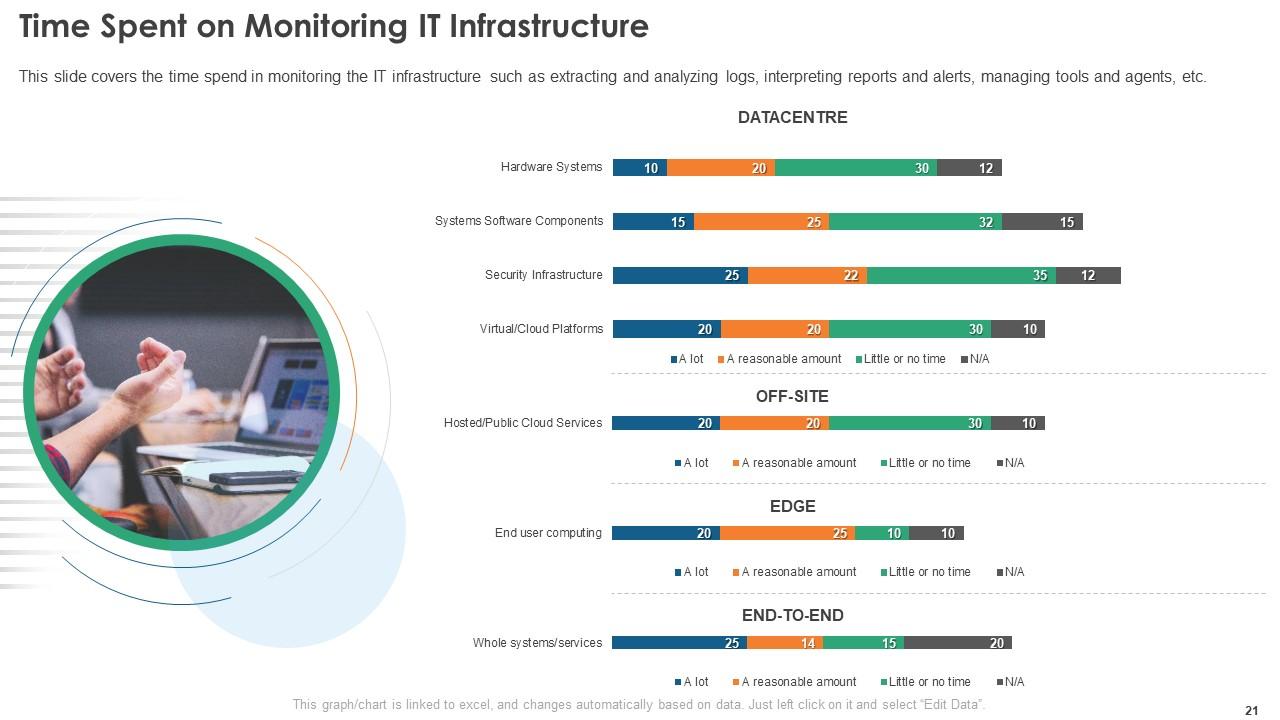
Slide 21: This slide displays Time Spent on Monitoring IT Infrastructure.
Slide 22: This slide highlights title for topics that are to be covered next in the template.
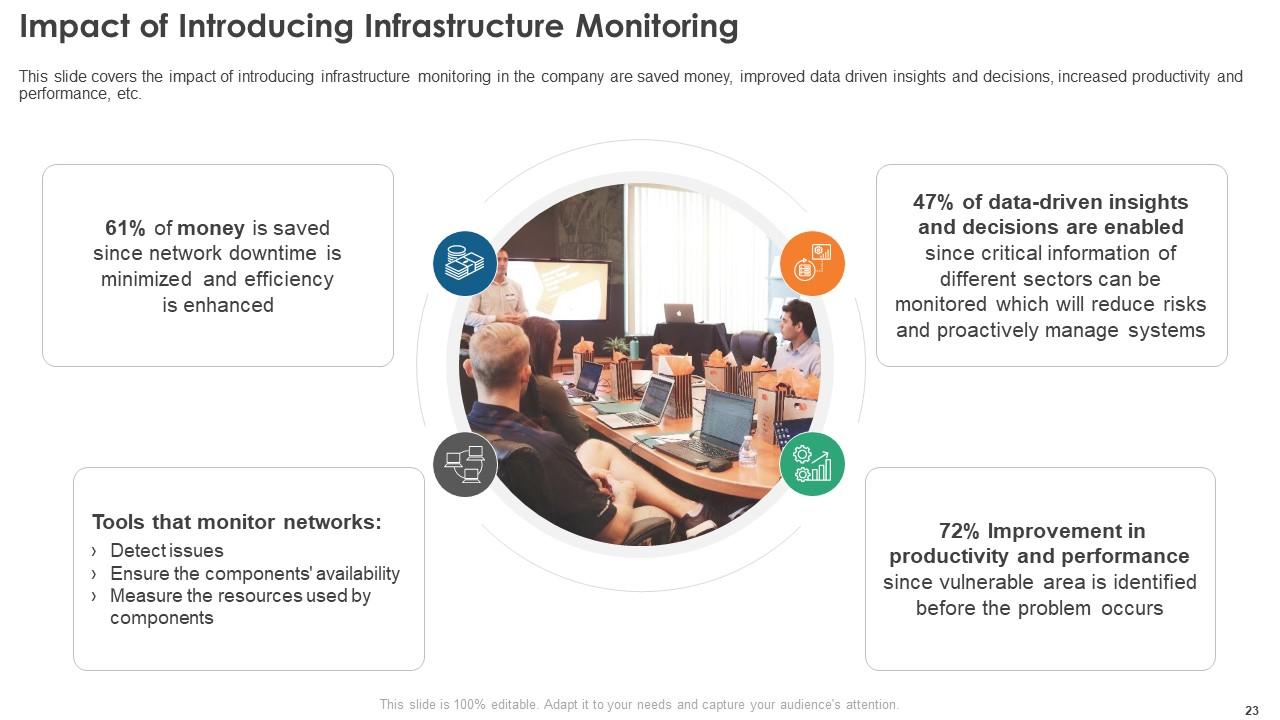
Slide 23: This slide represents Impact of Introducing Infrastructure Monitoring.
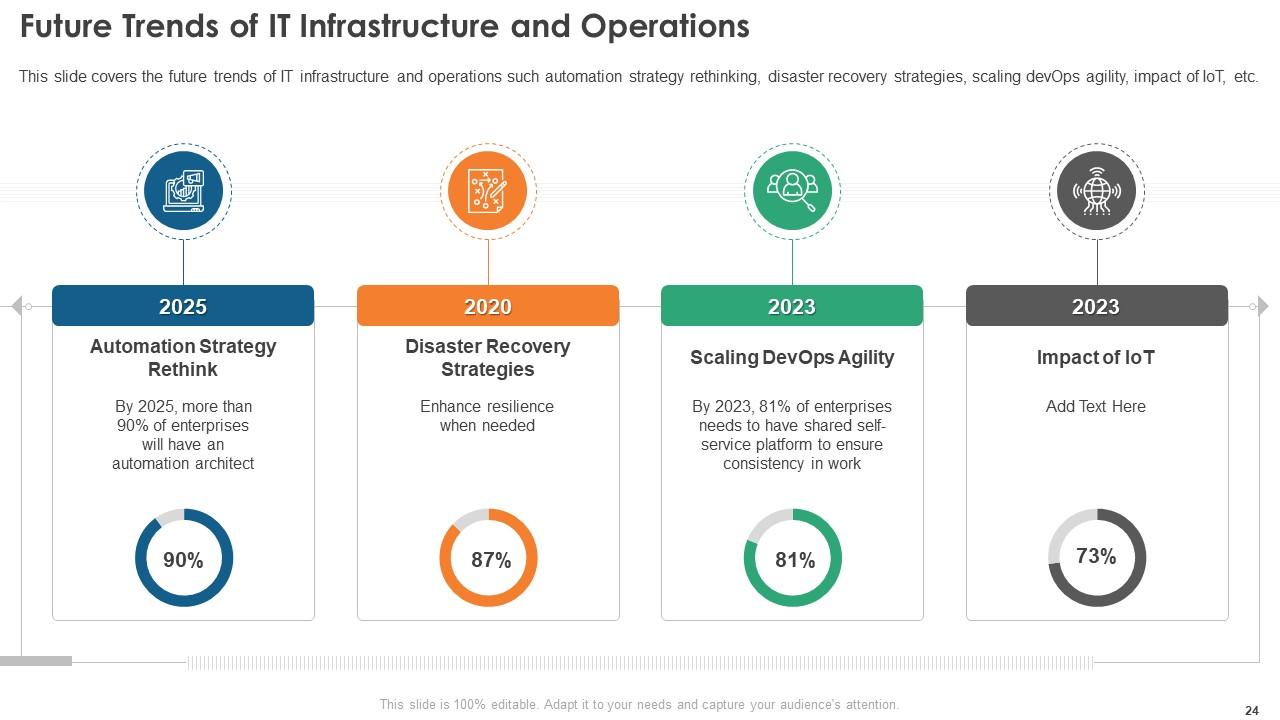
Slide 24: This slide showcases Future Trends of IT Infrastructure and Operations.
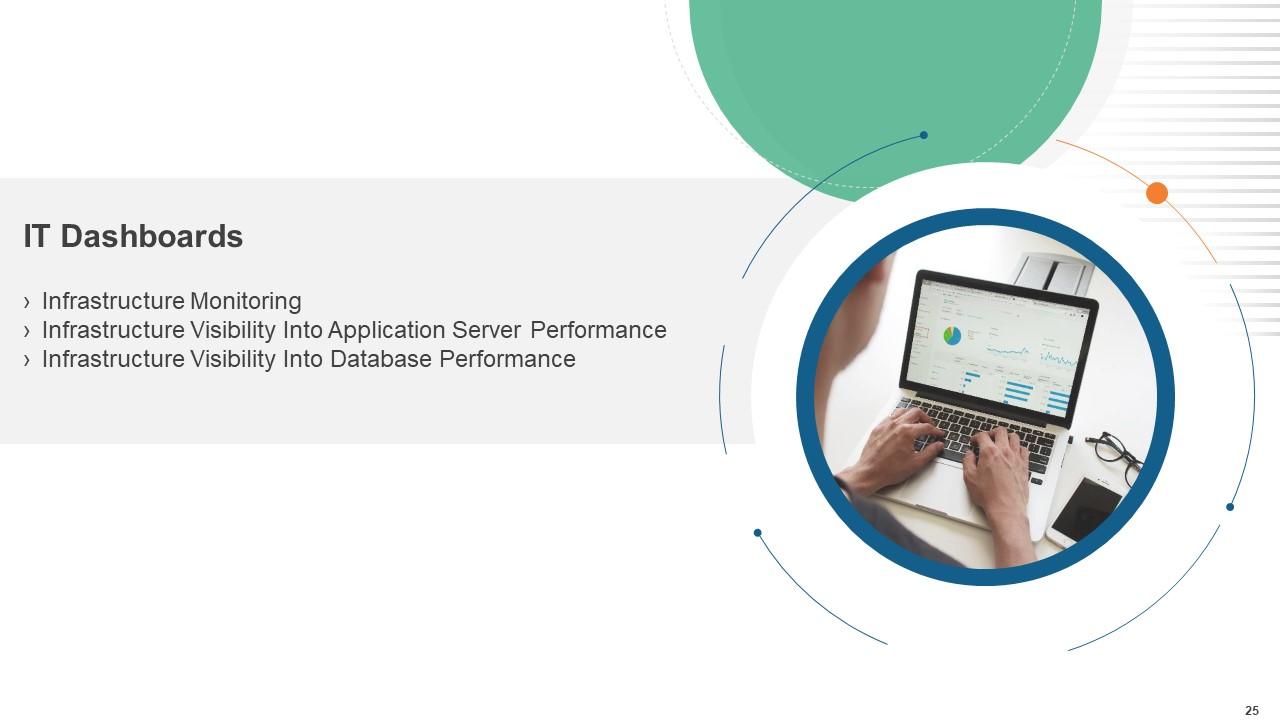
Slide 25: This slide highlights title for topics that are to be covered next in the template.
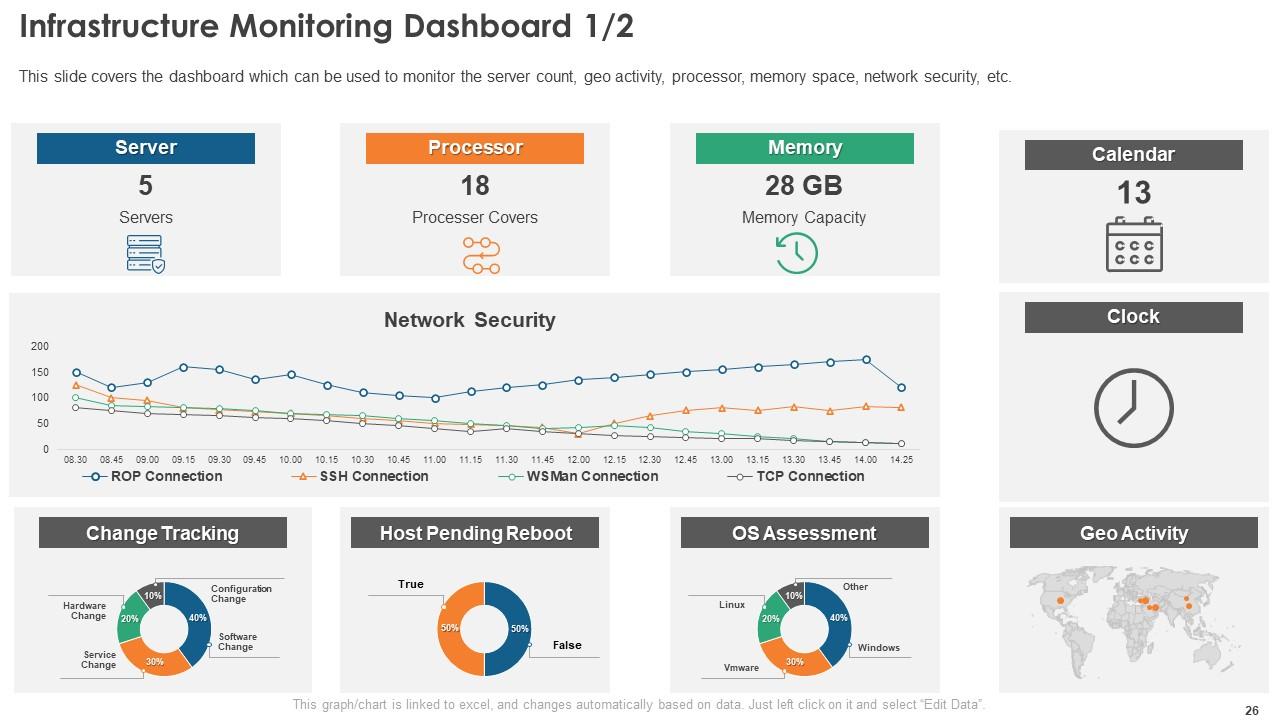
Slide 26: This slide covers the dashboard which can be used to monitor the server count, geo activity, processor, etc.
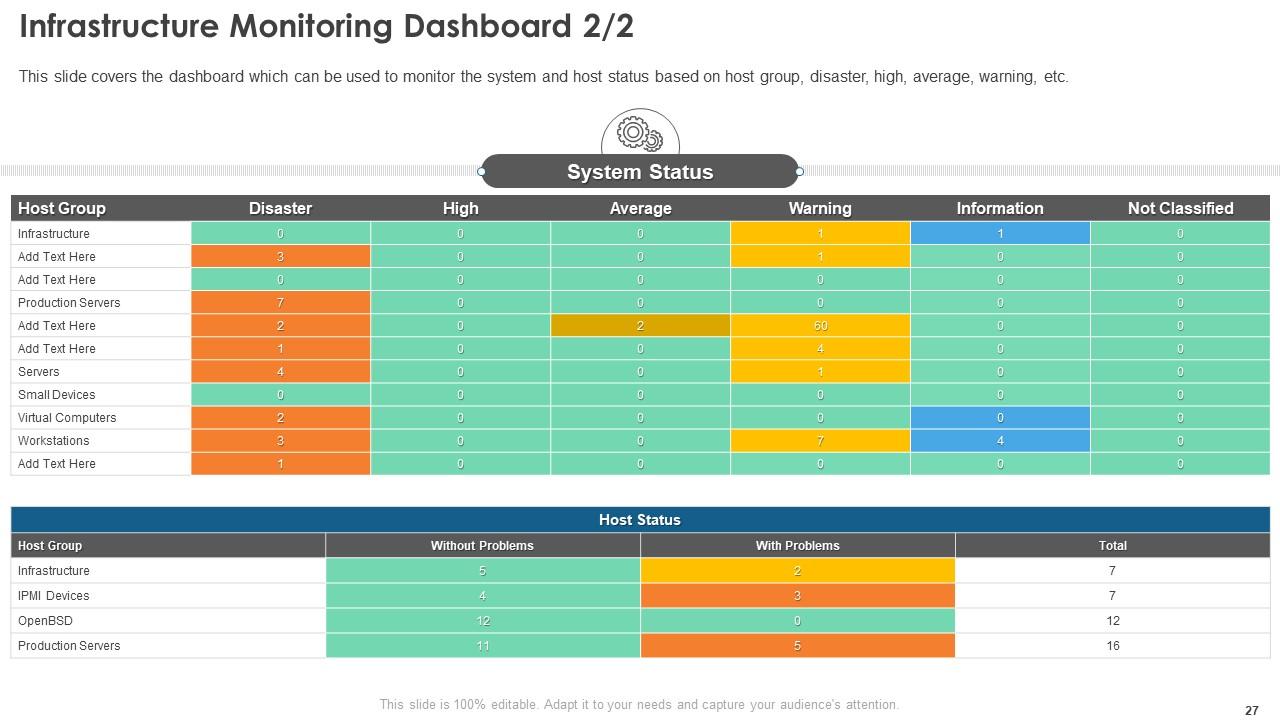
Slide 27: This is another slide continuing the dashboard which can be used to monitor the system and host status.
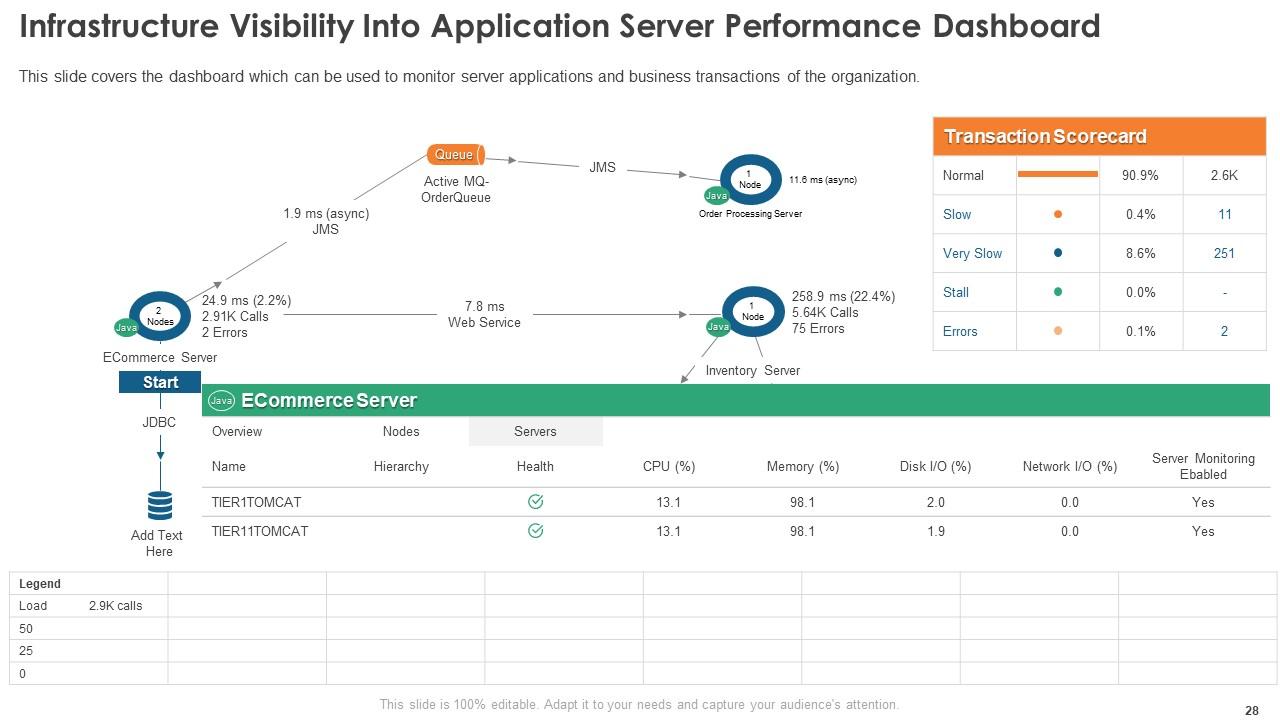
Slide 28: This slide showcases Infrastructure Visibility Into Application Server Performance Dashboard.
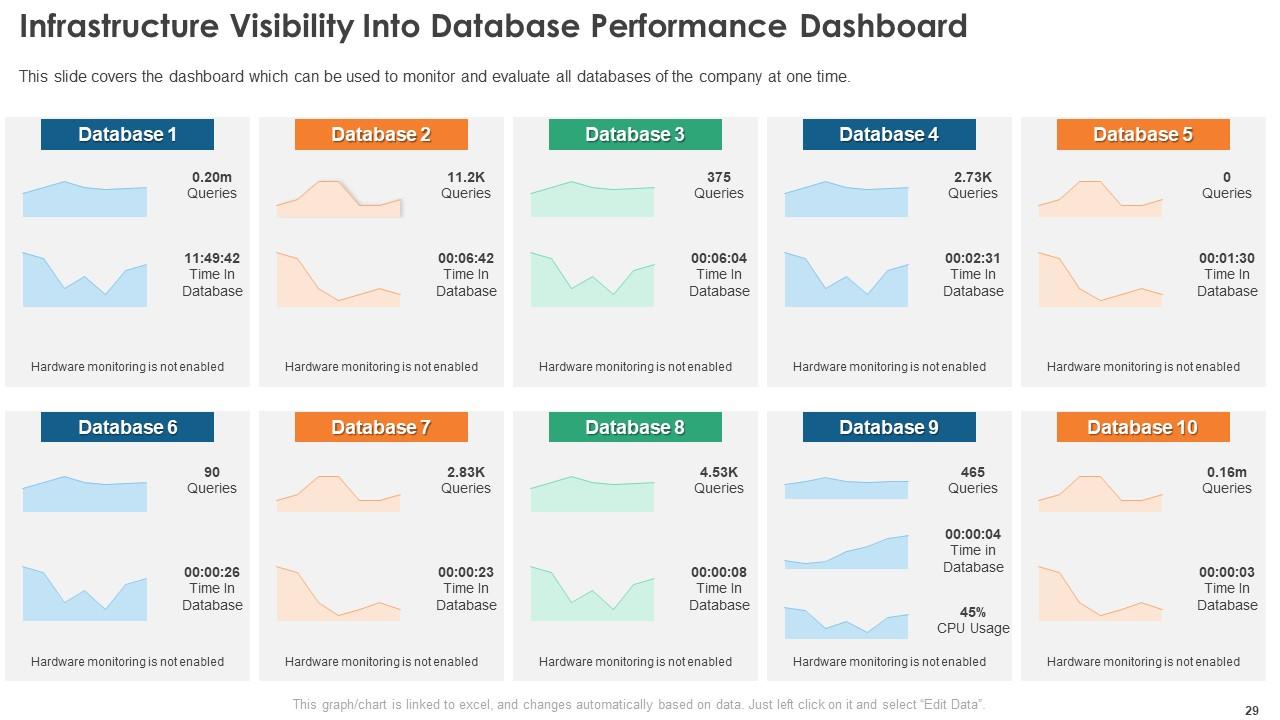
Slide 29: This slide shows Infrastructure Visibility Into Database Performance Dashboard.
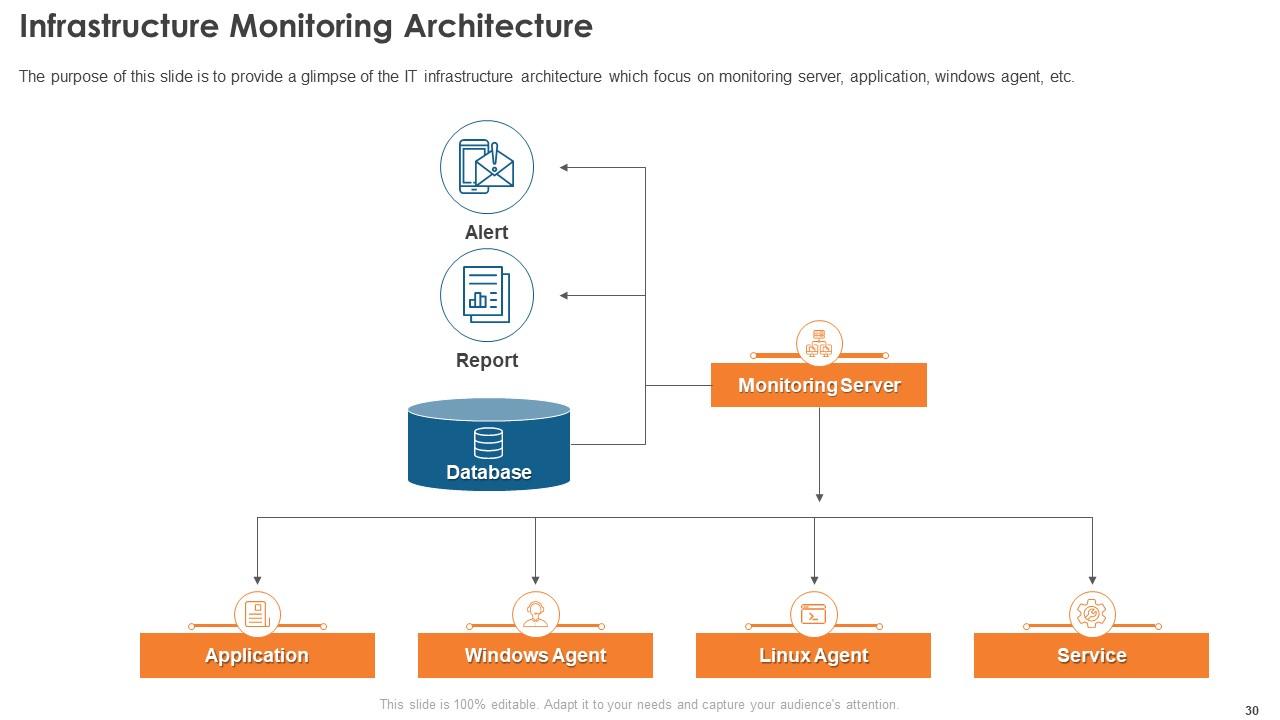
Slide 30: This slide presents Infrastructure Monitoring Architecture.
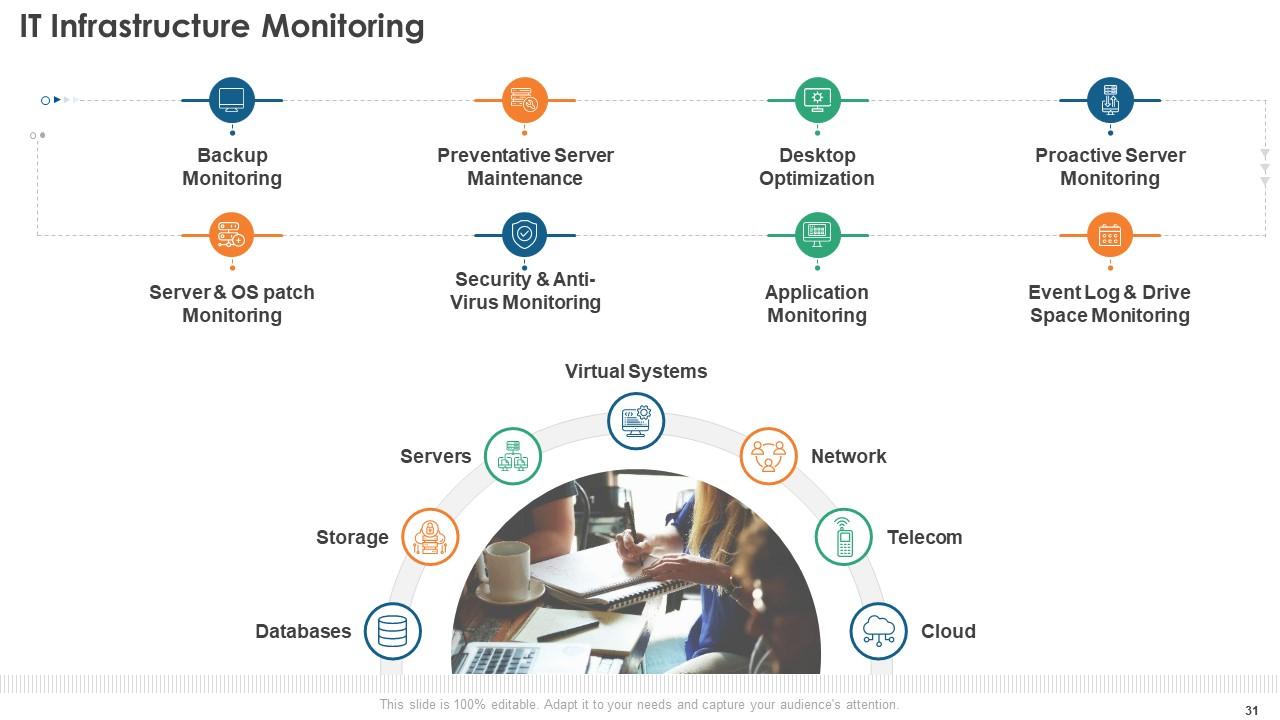
Slide 31: This slide displays IT Infrastructure Monitoring describing- Databases, Monitoring, Preventative Server Maintenance, etc.
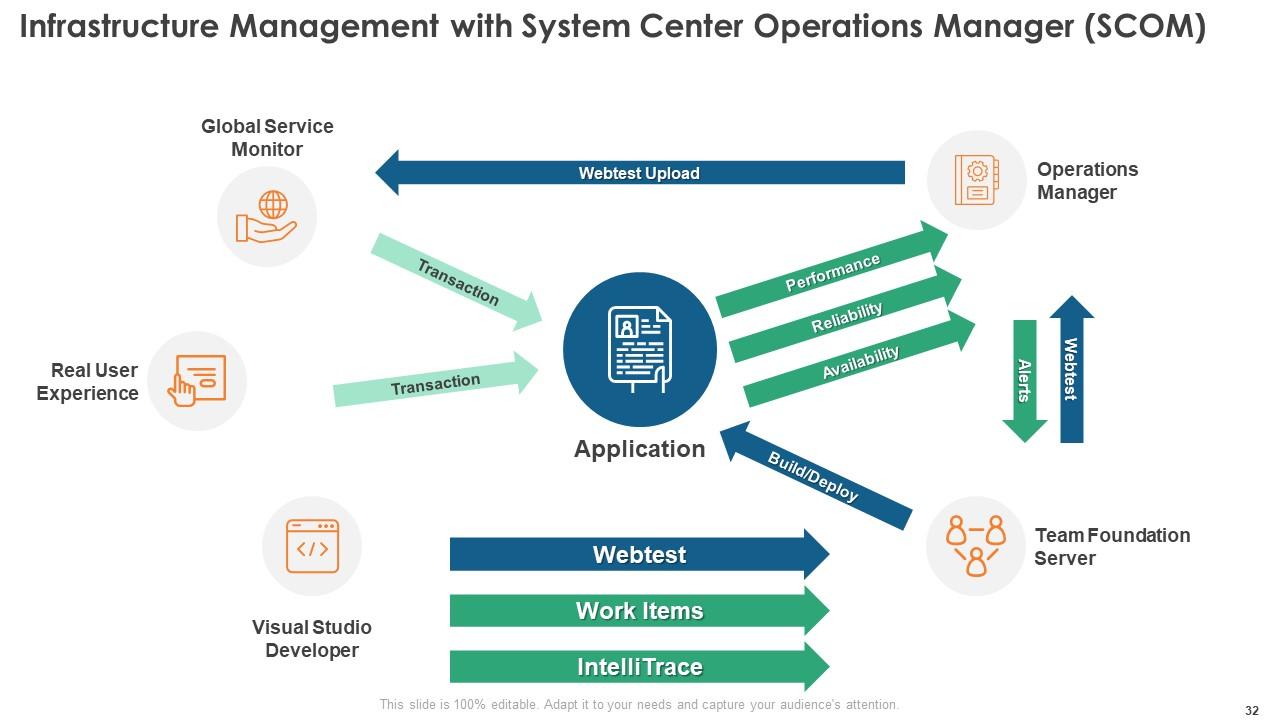
Slide 32: IThis slide represents nfrastructure Management with System Center Operations Manager (SCOM).
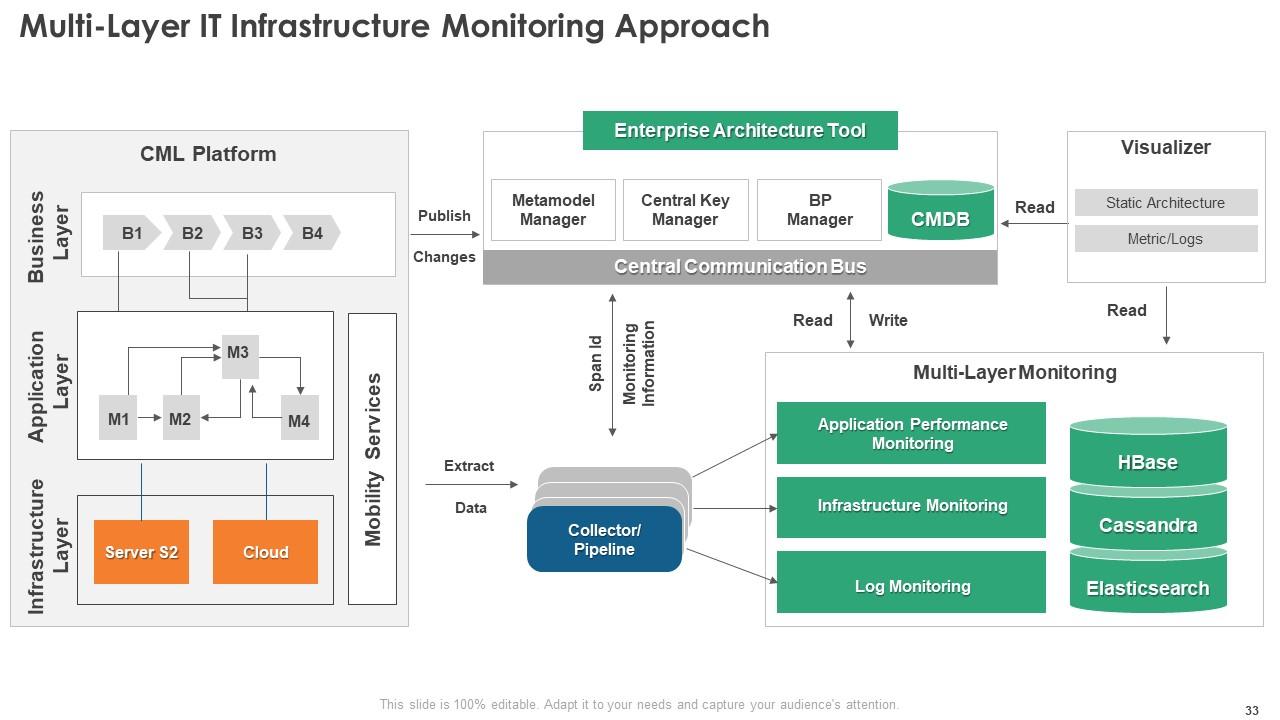
Slide 33: This slide showcases Multi-Layer IT Infrastructure Monitoring Approach.
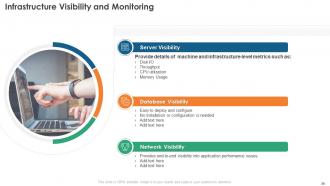
Slide 34: This slide displays Infrastructure Visibility and Monitoring.
Slide 35: This slide showcases Icons for Infrastructure Monitoring.
Slide 36: This slide is titled as Additional Slides for moving forward.
Slide 37: This slide provides 30 60 90 Days Plan with text boxes.
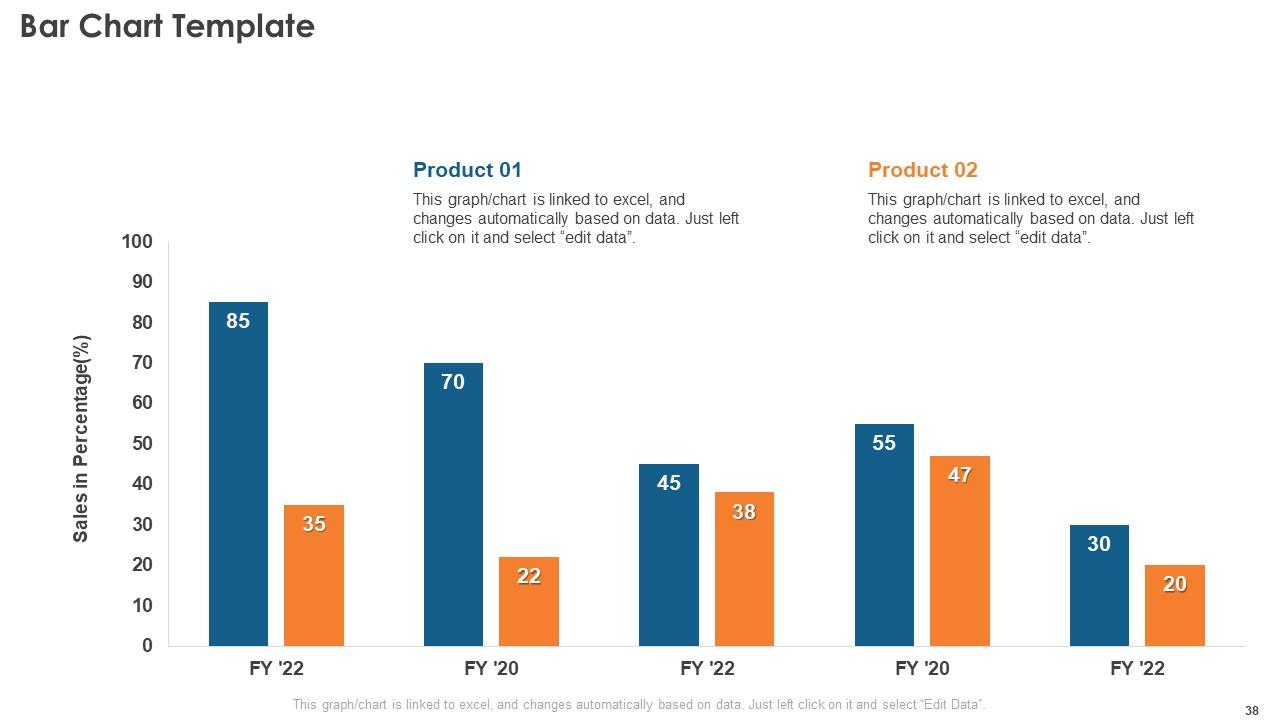
Slide 38: This slide presents Bar chart with two products comparison.
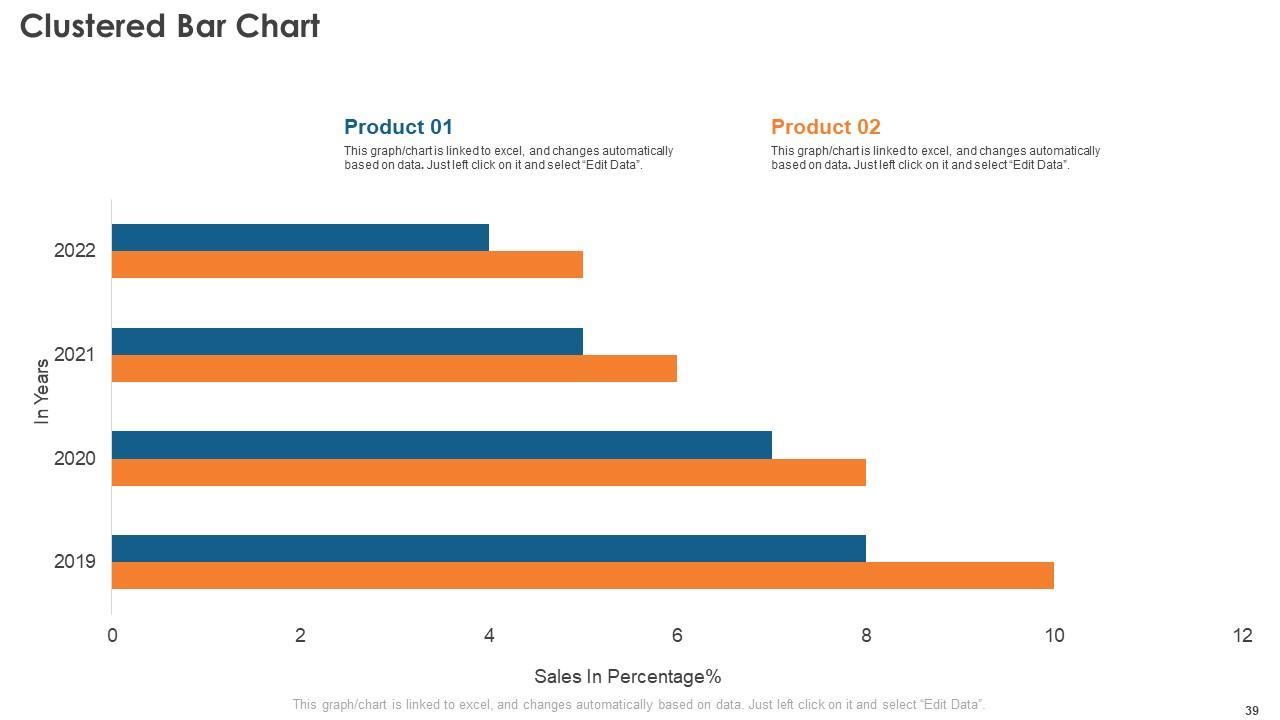
Slide 39: This slide provides Clustered Bar chart with two products comparison.
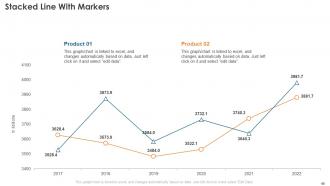
Slide 40: This slide showcases Stacked Line With Markers.
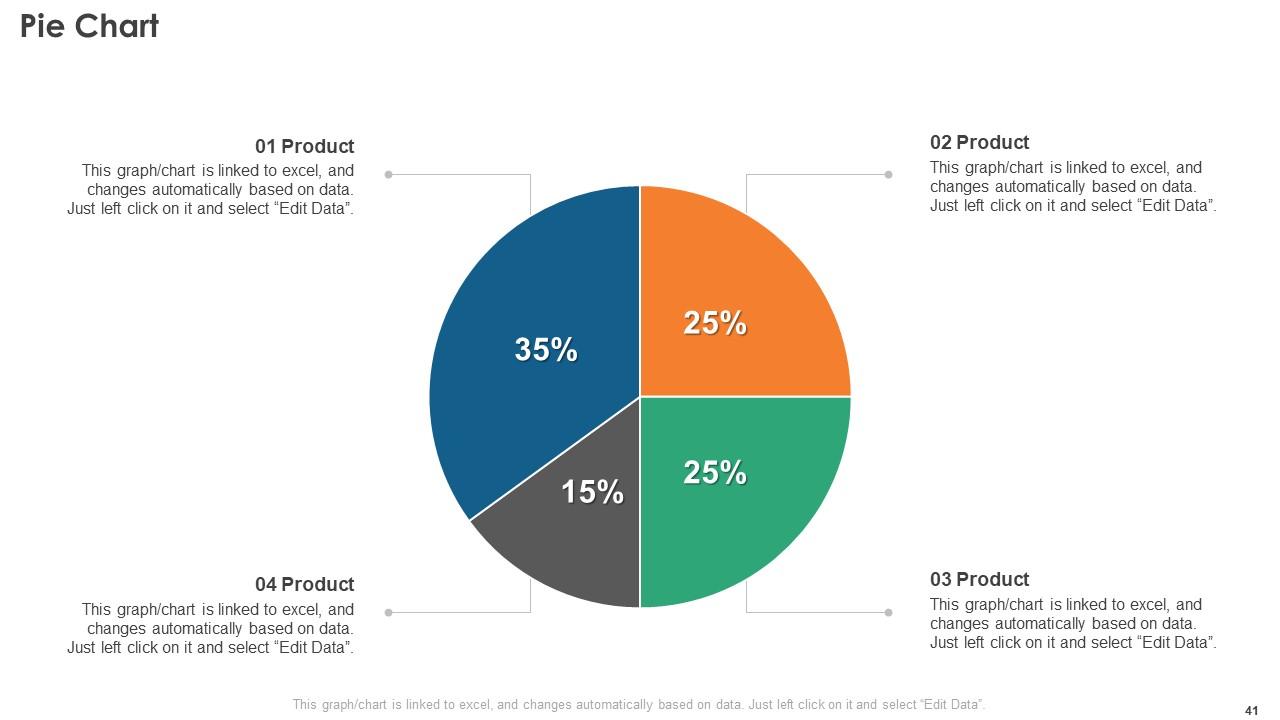
Slide 41: This slide shows Pie Chart with data in percentage.
Slide 42: This is Our Team slide with names and designation.
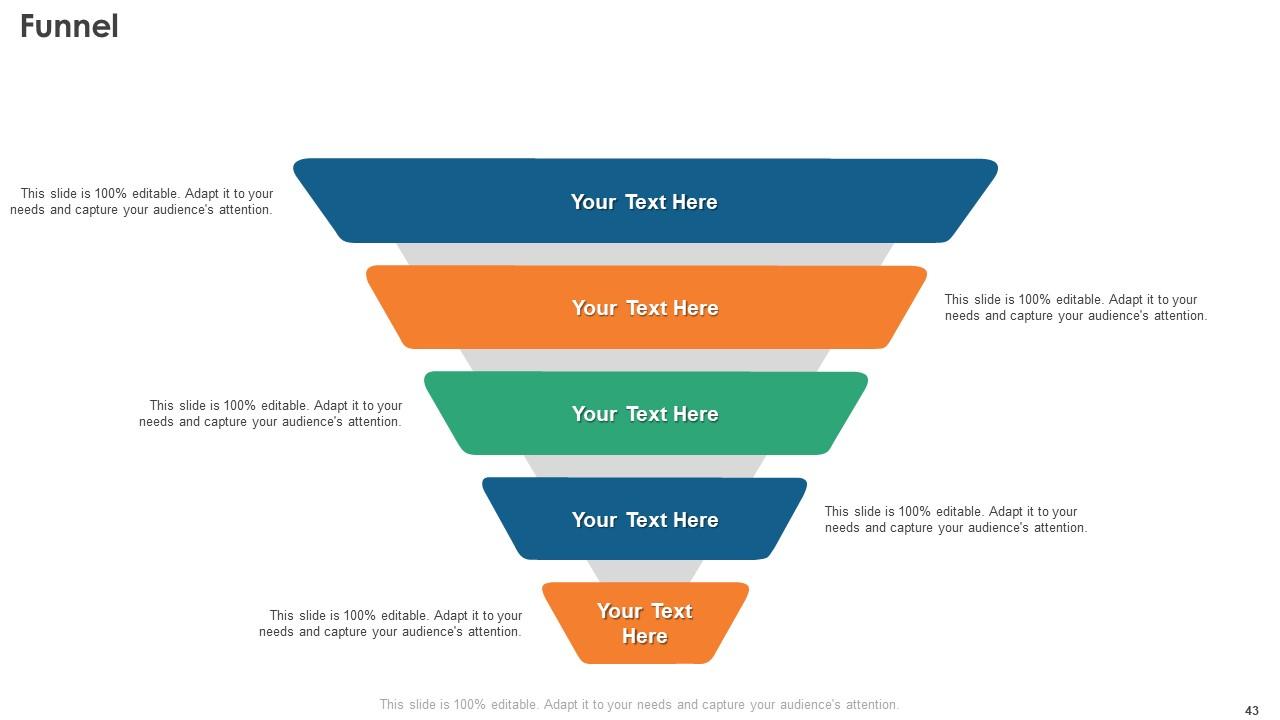
Slide 43: This slide shows Funnel with related icons and text.
Slide 44: This is Our Target slide. State your targets here.
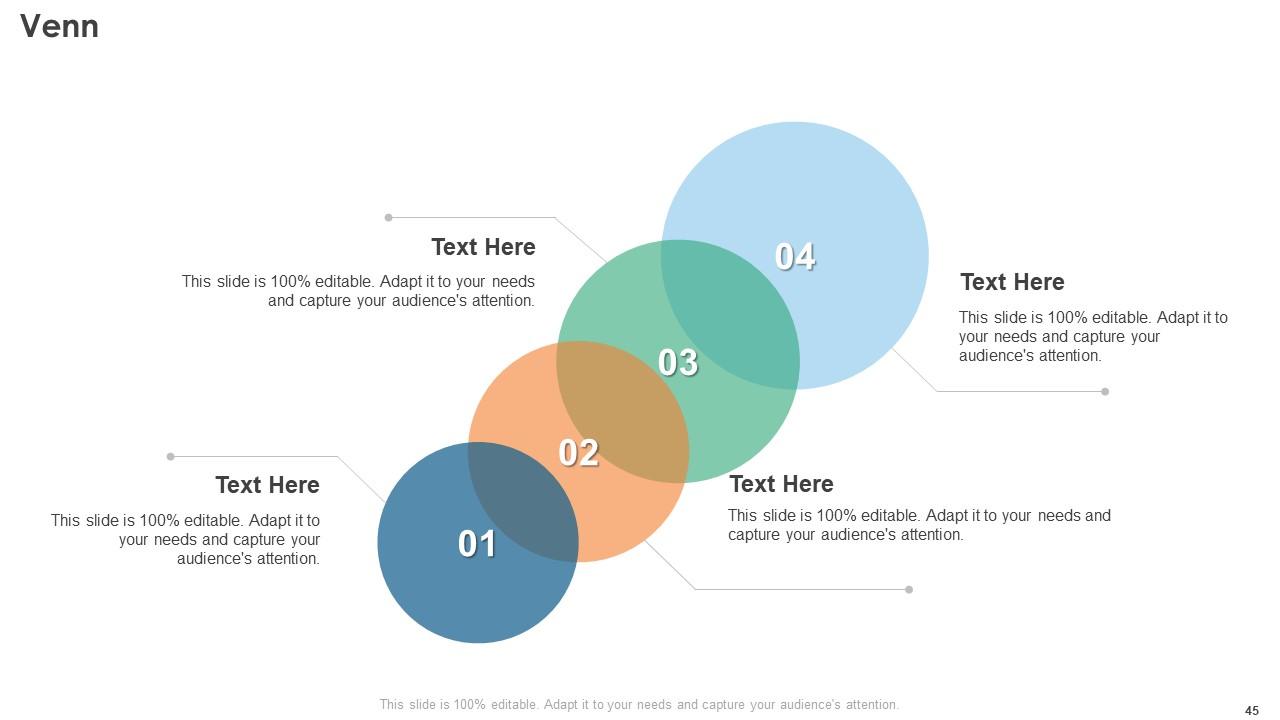
Slide 45: This slide depicts Venn diagram with text boxes.
Slide 46: This slide presents Silhouettes with additional textboxes.
Slide 47: This slide showcases Magnifying Glass to highlight information, specifications, etc.
Slide 48: This slide shows Circular Diagram with additional textboxes.
Slide 49: This slide shows Post It Notes. Post your important notes here.
Slide 50: This slide contains Puzzle with related icons and text.
Slide 51: This is Our Goal slide. State your firm's goals here.
Slide 52: This slide showcases Magnifying Glass to highlight information, specifications, etc.
Slide 53: This is a Thank You slide with address, contact numbers and email address.
Infrastructure Monitoring Powerpoint Presentation Slides with all 58 slides:
Use our Infrastructure Monitoring Powerpoint Presentation Slides to effectively help you save your valuable time. They are readymade to fit into any presentation structure.
-
great
-
Based on my personal experience, I would recommend other people to subscribe to SlideTeam. No one can be disappointed here!
-
Their templates are super easy to edit and use even for the one like me who is not familiar with PowerPoint. Great customer support.


