

Infrastrukturüberwachung PowerPoint-Präsentationsfolien





Try Before you Buy Download Free Sample Product
 Impress Your
Audience
 100%
Editable
 Save Hours
of Time


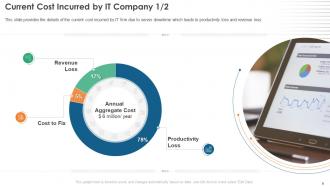
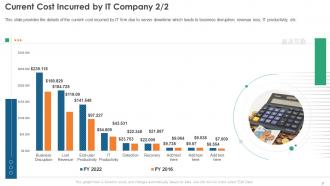
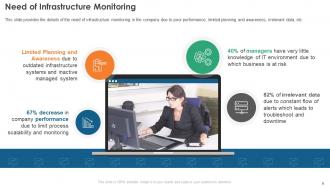
Infrastrukturüberwachung ist der Geschäftsprozess, der einer IT-Organisation gehört und von ihr betrieben wird. Sehen Sie sich unsere effizient gestaltete Infrastrukturüberwachungsvorlage an. Wir haben die dem Unternehmen entstandenen Kosten in Form eines Ringdiagramms und eines Balkendiagramms für Produktivität, Reparaturkosten, Umsatzverlust usw. bewertet. Die Überwachung ist im Unternehmen aufgrund von schlechter Leistung, begrenzter Planung, Bewusstsein, irrelevanten Daten, usw. Wir haben uns auf die Herausforderungen des Infrastrukturmanagements konzentriert, wie z. B. das Fehlen leistungsfähiger Computerplattformen, Datenerfassung usw., und deren Lösungen. Diese Vorlage deckt die Schritte ab, die für die Implementierung der Überwachung der IT-Infrastruktur erforderlich sind, wie z. B. Erfassung, Speicherung, Auswertung, Interaktion usw. Hier werden verschiedene Arten von Überwachungstools und ihre Funktionen und Dienste besprochen. Diese Folie deckt auch die Kosten und den Zeitaufwand ab, der für die Überwachung der IT-Infrastruktur erforderlich ist. Darüber hinaus werden hier die Auswirkungen der Überwachungsinfrastruktur auf das Unternehmen als zukünftige Trends behandelt. In dieser Vorlage werden verschiedene Dashboards geteilt, die für die Infrastrukturüberwachung, die Leistung von Anwendungsservern usw. verwendet werden können. Holen Sie sich jetzt Zugriff.
People who downloaded this PowerPoint presentation also viewed the following :
Inhalt dieser Powerpoint-Präsentation
Folie 1 : Diese Folie stellt die Infrastrukturüberwachung vor. Geben Sie Ihren Firmennamen an und beginnen Sie.
Folie 2 : Diese Folie gibt die Agenda der Präsentation an.
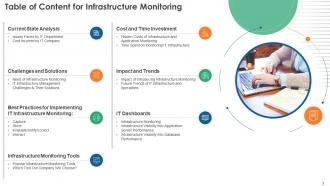
Folie 3 : Diese Folie zeigt das Inhaltsverzeichnis für die Präsentation.
Folie 4 : Diese Folie hebt Titel für Themen hervor, die als nächstes in der Vorlage behandelt werden sollen.
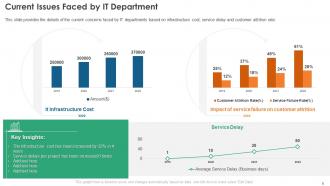
Folie 5 : Diese Folie stellt aktuelle Probleme dar, mit denen die IT-Abteilung konfrontiert ist.
Folie 6 : Diese Folie zeigt die aktuellen Kosten des IT-Unternehmens.
Folie 7 : Dies ist eine weitere Folie, die die laufenden Kosten des IT-Unternehmens fortsetzt.
Folie 8 : Diese Folie hebt Titel für Themen hervor, die als nächstes in der Vorlage behandelt werden sollen.
Folie 9 : Diese Folie enthält die Details zum Bedarf an Infrastrukturüberwachung im Unternehmen.
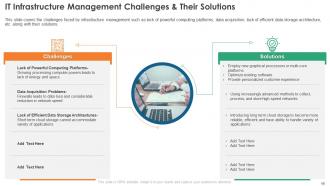
Folie 10 : Diese Folie präsentiert die Herausforderungen des IT-Infrastrukturmanagements und ihre Lösungen.
Folie 11 : Diese Folie hebt Titel für Themen hervor, die als nächstes in der Vorlage behandelt werden sollen.
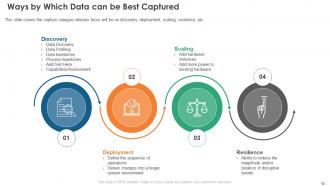
Folie 12 : Diese Folie zeigt Möglichkeiten, wie Daten am besten erfasst werden können.
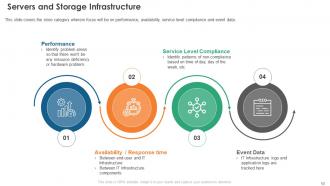
Folie 13 : Diese Folie deckt die Ladenkategorie ab, wobei der Schwerpunkt auf Leistung, Verfügbarkeit, Einhaltung der Service-Level usw. liegt.
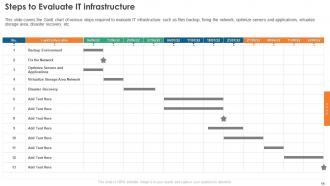
Folie 14 : Diese Folie zeigt das Gantt-Diagramm verschiedener Schritte, die zur Bewertung der IT-Infrastruktur erforderlich sind.
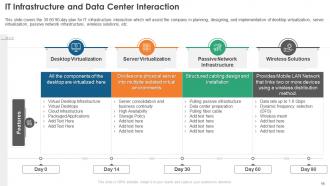
Folie 15 : Diese Folie präsentiert die Interaktion zwischen IT-Infrastruktur und Rechenzentrum.
Folie 16 : Diese Folie hebt Titel für Themen hervor, die als nächstes in der Vorlage behandelt werden sollen.
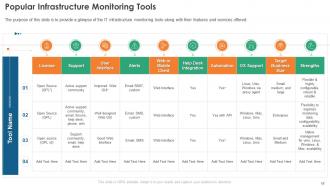
Folie 17 : Diese Folie zeigt beliebte Tools zur Infrastrukturüberwachung.
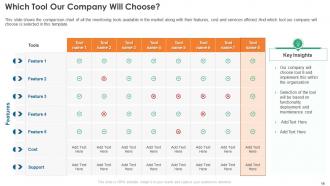
Folie 18 : Diese Folie zeigt die Vergleichstabelle aller auf dem Markt erhältlichen Überwachungstools.
Folie 19 : Diese Folie hebt Titel für Themen hervor, die als nächstes in der Vorlage behandelt werden sollen.
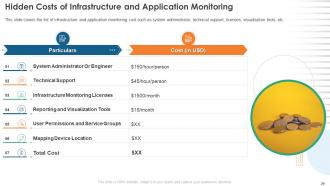
Folie 20 : Diese Folie zeigt versteckte Kosten der Infrastruktur- und Anwendungsüberwachung.
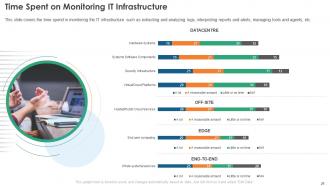
Folie 21 : Diese Folie zeigt die für die Überwachung der IT-Infrastruktur aufgewendete Zeit.
Folie 22 : Diese Folie hebt Titel für Themen hervor, die als nächstes in der Vorlage behandelt werden sollen.
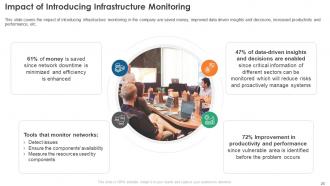
Folie 23 : Diese Folie zeigt die Auswirkungen der Einführung der Infrastrukturüberwachung.
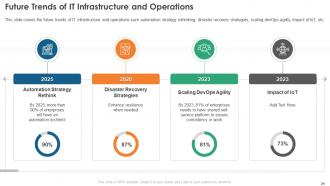
Folie 24 : Diese Folie zeigt zukünftige Trends der IT-Infrastruktur und des IT-Betriebs.
Folie 25 : Diese Folie hebt Titel für Themen hervor, die als nächstes in der Vorlage behandelt werden sollen.
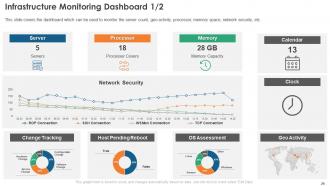
Folie 26 : Diese Folie deckt das Dashboard ab, das zur Überwachung der Serveranzahl, der Geoaktivität, des Prozessors usw. verwendet werden kann.
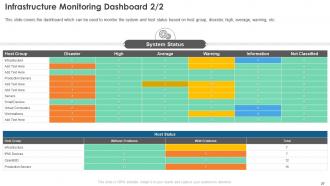
Folie 27 : Dies ist eine weitere Folie, die das Dashboard fortsetzt, das zur Überwachung des System- und Hoststatus verwendet werden kann.
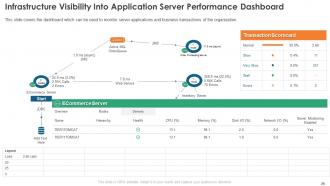
Folie 28 : Diese Folie zeigt die Transparenz der Infrastruktur im Dashboard für die Leistung des Anwendungsservers.
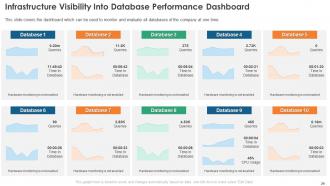
Folie 29 : Diese Folie zeigt die Transparenz der Infrastruktur im Datenbankleistungs-Dashboard.
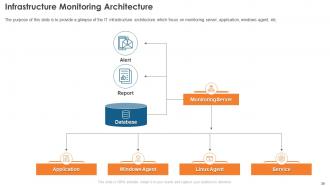
Folie 30 : Diese Folie stellt die Infrastrukturüberwachungsarchitektur vor.
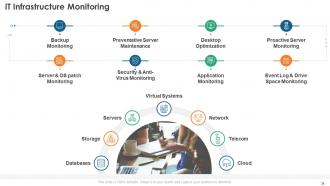
Folie 31 : Diese Folie zeigt die Überwachung der IT-Infrastruktur und beschreibt Datenbanken, Überwachung, vorbeugende Serverwartung usw.
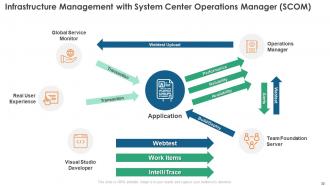
Folie 32 : IDiese Folie stellt das Infrastrukturmanagement mit System Center Operations Manager (SCOM) dar.
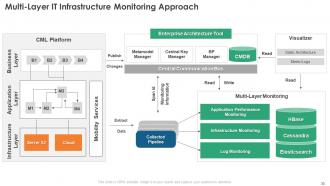
Folie 33 : Diese Folie zeigt den mehrschichtigen Ansatz zur Überwachung der IT-Infrastruktur.
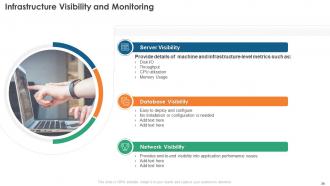
Folie 34 : Diese Folie zeigt die Sichtbarkeit und Überwachung der Infrastruktur.
Folie 35 : Diese Folie zeigt Symbole für die Infrastrukturüberwachung.
Folie 36 : Diese Folie trägt den Titel „Zusätzliche Folien“, um voranzukommen.
Folie 37 : Diese Folie enthält einen 30-60-90-Tage-Plan mit Textfeldern.
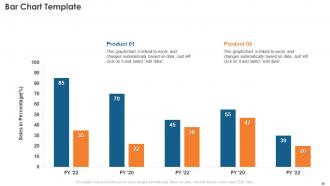
Folie 38 : Diese Folie zeigt ein Balkendiagramm mit zwei Produktvergleichen.
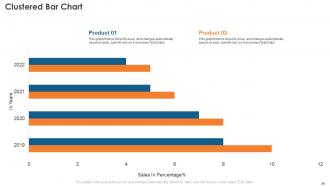
Folie 39 : Diese Folie bietet ein gruppiertes Balkendiagramm mit zwei Produktvergleichen.
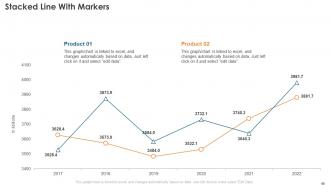
Folie 40 : Diese Folie zeigt eine gestapelte Linie mit Markierungen.
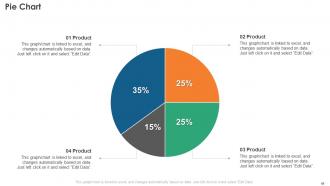
Folie 41 : Diese Folie zeigt ein Tortendiagramm mit Daten in Prozent.
Folie 42 : Dies ist die Folie „Unser Team“ mit Namen und Bezeichnung.
Folie 43 : Diese Folie zeigt Trichter mit zugehörigen Symbolen und Text.
Folie 44 : Dies ist unsere Zielfolie. Geben Sie hier Ihre Ziele an.
Folie 45 : Diese Folie zeigt ein Venn-Diagramm mit Textfeldern.
Folie 46 : Diese Folie präsentiert Silhouetten mit zusätzlichen Textfeldern.
Folie 47 : Diese Folie zeigt eine Lupe, um Informationen, Spezifikationen usw. hervorzuheben.
Folie 48 : Diese Folie zeigt ein Kreisdiagramm mit zusätzlichen Textfeldern.
Folie 49 : Diese Folie zeigt Haftnotizen. Posten Sie hier Ihre wichtigen Notizen.
Folie 50 : Diese Folie enthält ein Puzzle mit zugehörigen Symbolen und Text.
Folie 51 : Dies ist unsere Zielfolie. Geben Sie hier die Ziele Ihres Unternehmens an.
Folie 52 : Diese Folie zeigt eine Lupe, um Informationen, Spezifikationen usw. hervorzuheben.
Folie 53 : Dies ist eine Dankeschön-Folie mit Adresse, Kontaktnummern und E-Mail-Adresse.
Infrastrukturüberwachung PowerPoint-Präsentationsfolien mit allen 58 Folien:
Verwenden Sie unsere Powerpoint-Präsentationsfolien zum Infrastruktur-Monitoring, um Ihre wertvolle Zeit effektiv zu sparen. Sie sind gebrauchsfertig und passen in jede Präsentationsstruktur.








FAQs for Infrastructure Monitoring
So you'll need four main things: agents collecting data from all your systems, some centralized platform to dump all the logs, smart alerting (seriously, most people screw this up and create alert fatigue), and dashboards showing real-time stuff. Oh and automated discovery is clutch - new servers just get picked up automatically without you doing anything. Keep historical data around too for spotting trends. The alerting thing though... that's where teams always go wrong. Too much noise and people start ignoring everything. Just start with your most critical systems first, then grow from there.
So basically, cloud monitoring is all about APIs and whatever metrics the service gives you - like when you're checking EC2 instances through AWS dashboards. On-premises is totally different. You're installing agents right on the servers and can see everything - CPU temps, disk I/O, the works. Cloud providers handle that hardware stuff for you, which is honestly pretty nice. You also get auto-scaling metrics now that weren't even relevant before. The tools change too since cloud platforms have their own monitoring built right in. I'd start by figuring out which services you're actually running, then see what data each one spits out.
So you've got two main things to track - metrics and logs. Metrics are your numbers: CPU usage, memory, response times, all that graphable stuff you can set alerts on. Logs are different though - they're like your crime scene evidence when everything breaks (which it definitely will). Honestly, logs are a lifesaver because while metrics show you something's broken, logs actually tell you what the hell happened. I'd start with the key metrics for alerts first, then make sure you can actually search through your logs later when you're troubleshooting at 2am.
Honestly, start with something like Datadog or Prometheus - they're solid for pulling metrics from all your stuff in real-time. Build dashboards showing CPU, memory, disk usage, network health, the usual suspects. But here's the thing - set your alert thresholds smart so you catch problems before users start yelling at you (trust me on this one). I'd focus on your most critical systems first, then slowly add more coverage. The whole point is getting everything feeding into one central place so you're not hunting around ten different tools when things go sideways.
Honestly, the worst part is drowning in useless metrics and constant alerts. Your phone will blow up with notifications that mean nothing. Getting a clear view across different environments is brutal too - cloud stuff mixed with on-premise makes everything messy. Each team picks their favorite tools, so you're stuck juggling multiple dashboards that can't share data (super annoying). Setting the right alert thresholds? Way harder than expected. Go too tight and you'll hate your life from false alarms. Too loose and actual problems slip by. Figure out what really matters first before installing anything - trust me on this one.
So basically, you want to catch stuff before it breaks instead of finding out when angry users start calling. Monitor your CPU usage, response times, that kind of thing. Set up alerts when numbers get weird - way better than playing whack-a-mole after everything's on fire. Honestly, it's like having a smoke detector vs waiting for the fire department. Start small though, maybe just your main services first. Don't go crazy trying to monitor every little thing right away. When something looks off, you'll actually have time to fix it properly.
CPU usage, memory, disk I/O, and network throughput - those are your must-haves. Honestly, disk space monitoring saved me so many headaches too because nothing kills a Friday like running out of storage. Response times and error rates? Gold for catching issues early. Set up alerts on these first, then worry about making things pretty later. Oh, and don't overcomplicate it at the start - I've seen people build these massive dashboards that nobody actually uses. Keep it simple.
Look, automation just handles all the boring stuff you don't want to do anyway. Set up smart monitoring that knows which alerts actually matter - no more checking dashboards constantly like some kind of masochist. It'll do log rotation, catch performance issues, even fix simple problems by itself. The cool part? You can focus on interesting work while it babysits everything 24/7. Honestly, predictive maintenance alone will save your sanity since it spots trouble before you're scrambling to fix outages. My advice: start with whatever repetitive task annoys you most and automate that first.
Dude, the pattern recognition alone is worth it - AI catches stuff in your infrastructure data that would take us humans ages to spot. Early failure warnings before things actually break? Total game-changer. No more reactive scrambling when servers die at 3am. False alerts get filtered out automatically too, which honestly saves so much sanity. The system learns what's normal for your setup over time. I mean, yeah there's a learning curve, but you'll shift from constantly putting out fires to actually preventing them. Way less stress and your budget will thank you.
Honestly, just build monitoring right into your CI/CD from the start. Version control those configs with your app code - Prometheus, Datadog, New Relic all have APIs for automating dashboard and alert setup during deployments. Don't be like those teams who try adding it later and then hate their lives. Test your monitoring configs too. Oh, and make sure alerts actually matter when they fire, not just endless noise that trains everyone to ignore them. Way too many places mess this up.
So here's what's worked for me - start with data sampling since that'll give you the biggest bang for your buck right away. Instead of grabbing every single metric, use statistical sampling for the high-volume stuff. Spread your monitoring across multiple collectors too, way better than one giant system that could crap out on you. Time-series databases are clutch if you're not using one already, they handle this workload so much better. Oh and definitely set up smart alert grouping - trust me, you don't want your team getting buried in notification hell. That sampling thing though, do that first.
So basically you wanna track your current mess first - how often stuff breaks, how long fixes take, what downtime actually costs per hour. That's your starting point. Once you get monitoring tools running, measure how much faster you catch and solve problems. Honestly, the numbers usually look pretty good since one big outage you prevent can cover the whole tool cost for a year. Your team will also spend way less time putting out fires, which saves on labor costs too. Oh and document all your current "pain costs" upfront - makes it way easier to sell the investment later.
So here's what works for me - set up different alert levels where critical stuff pages people right away, but warnings can wait till morning. Alert fatigue is absolutely brutal, you don't want your team ignoring everything. Focus on business metrics that actually matter instead of random CPU thresholds. I always use multiple channels like Slack and SMS because stuff breaks. Include enough context so whoever gets woken up at 3am knows what's wrong and where to look. Oh, and test your alerts regularly - nothing worse than finding out your monitoring was broken during an actual outage.
Honestly, think of infrastructure monitoring as your compliance safety net. It automatically tracks everything - uptime, security events, who accessed what and when. Auditors eat this stuff up because it's all timestamped and organized. The cool part is catching problems before they turn into actual violations (trust me, way easier than explaining screwups later). I'd start by figuring out what metrics your compliance people actually care about. Then build your dashboards around those specific requirements. You can even automate the reports so you're not pulling all-nighters when audit season rolls around. Makes the whole process so much less stressful.
Honestly, SolarWinds and PRTG are probably your best bet if you've got the budget - they'll show you everything happening on your network in real time. PRTG's interface is pretty slick actually. Nagios works too but it's more old-school. Tight on cash? Zabbix and LibreNMS do most of the same stuff for free. I'd avoid DataDog unless you're already deep into cloud stuff since it gets pricey fast. Start by figuring out which parts of your network you actually care about monitoring first. Then just pick whatever your team won't hate using - there's nothing worse than a monitoring tool nobody checks.
-
great
-
Based on my personal experience, I would recommend other people to subscribe to SlideTeam. No one can be disappointed here!
-
Their templates are super easy to edit and use even for the one like me who is not familiar with PowerPoint. Great customer support.