

Investor Pitch Deck Pe Powerpoint Presentation Slides





Try Before you Buy Download Free Sample Product
 Impress Your
 Audience
 100%
100% Editable
 Save Hours
 of Time


If you are looking for investor for your business, our content-ready investor pitch deck pe PowerPoint presentation slides will prove to be a must-have component in your toolkit. You can leverage these equity crowdfunding PPT templates to get familiar with topics such as organizational structure, executive summary, milestones achieved, product/services, USP, competitive landscape, technology trend, marketing strategy, financial summary, geographical expansion, and many more. Apart from these, related topics such as start-up funding, fundraising, seed funding, financial modelling, investor business proposal, angel investment and venture capital financing are also covered. It will help convince potential investors about your idea and hopefully encourage them to invest into your business. Download investor pitch deck pe PowerPoint presentation to deliver an impactful presentation in front of the investors. This can surely make your job of obtaining finance much easier. Get a sturdy leg up with our Investor Pitch Deck Pe Powerpoint Presentation Slides. Ascend the ladder of success with elan.
People who downloaded this PowerPoint presentation also viewed the following :
Content of this Powerpoint Presentation
Slide 1: This slide introduces Investor Pitch. State Your Company Name and get started.
Slide 2: This slide presents Table of Contents showcasing- Executive Summary, Key Highlights, Organizational Structure, Milestones Achieved, The Problem, The Solution, Geographical Footprint, Product / Services, Strong Customer Retention, Market Leader in a Segment, U.S.P Slide, Competitive Landscape, Technology Trend.
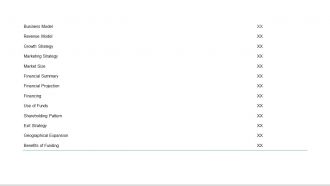
Slide 3: This slide presents Table of Contents showcasing- Business Model, Revenue Model, Growth Strategy, Marketing Strategy, Market Size, Financial Summary, Financial Projection, Financing, Use of Funds, Shareholding Pattern, Exit Strategy, Geographical Expansion, Benefits of Funding.
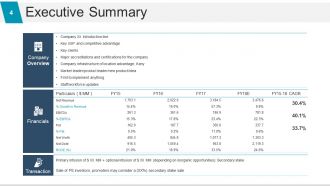
Slide 4: This slide presents Executive Summary displaying Company Overview, Financials and Transaction apsects to be shown.
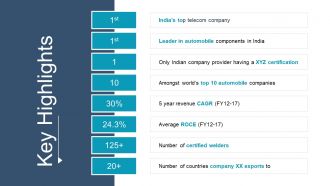
Slide 5: This is a Key Highlights slide to represent company highlights etc.
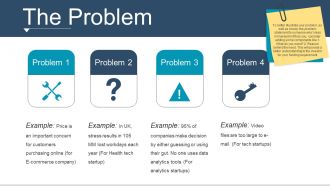
Slide 6: This is The Problem slide to present the current challenges faced. To better illustrate your problem, as well as convey the problem statement to someone who’s less immersed in it than you, consider adding some components like 1. What do you need? 2. Reason behind the need. This will provide a better understanding to the investor for your funding requirement.
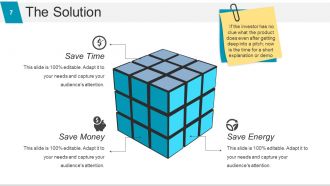
Slide 7: This slide displays The Solution such as- Save Time, Save Money, Save Energy. If the investor has no clue what the product does even after getting deep into a pitch; now is the time for a short explanation or demo.
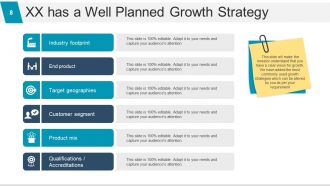
Slide 8: This slide shows XX has a Well Planned Growth Strategy displaying- Industry footprint, End product, Target geographies, Customer segment, Product mix, Qualifications /Accreditations. This slide will make the investor understand that you have a clear vision for growth. We have added the most commonly used growth strategies which can be altered by you as per your requirement.
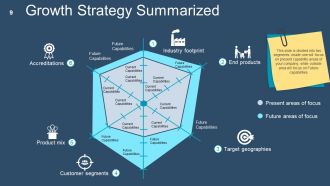
Slide 9: This slide shows Growth Strategy Summarized displaying- Present areas of Focus, Future areas of Focus, Accreditations, Product Mix, Customer Segments, Target Geographies, End Products, Industry Footprint, Future Capabilities, Current Capabilities. This slide is divided into two segments: inside one will focus on present capability areas of your company; while outside area will focus on Future capabilities
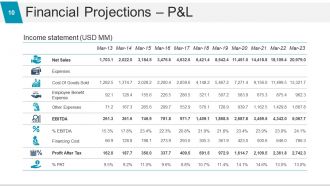
Slide 10: This is a slide on Financial Projections – Income Statement in tabular form.
Slide 11: This is a Financial Projections – Balance Sheet slide in tabular form.
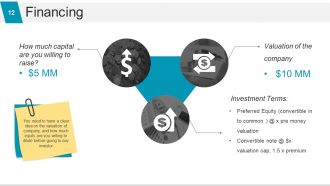
Slide 12: This slide shows Financing displaying- Investment Terms, Valuation of the company as examples. You need to have a clear idea on the valuation of company, and how much equity are you willing to dilute before going to any investor.
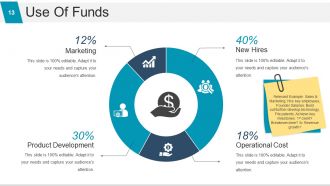
Slide 13: This slide presents Use of Funds showcasing- New Hires, Operational Cost, Marketing, Product Development.
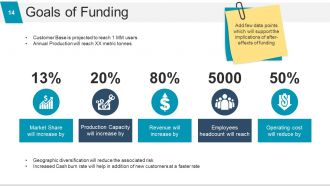
Slide 14: This slide displays Goals of Funding. State your funding goals etc. here.
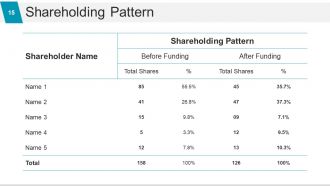
Slide 15: This slide showcases Shareholding Pattern in tabular form.
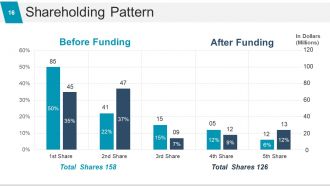
Slide 16: This slide showcases Shareholding Pattern in graph form.
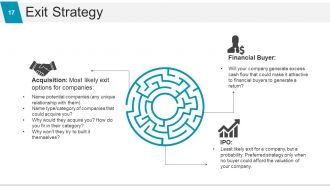
Slide 17: This slide presents the Exit Strategy categorized into- Financial Buyer, Acquisition, IPO.
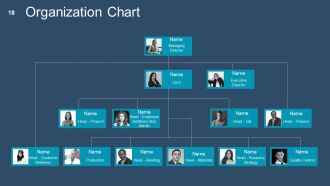
Slide 18: This slide displays an Organization Chart to present structure of the proposed organization.
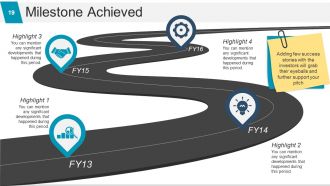
Slide 19: This slide presents Milestones Achieved so far. Adding few success stories with the investors will grab their eyeballs and further support your pitch.
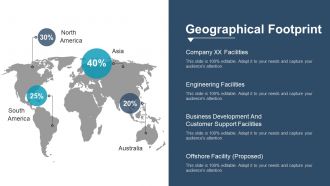
Slide 20: This slide showcases Geographical Footprint in world map image form. State- Global Presence, Company XX Facilities, Engineering Facilities, Business Development and Customer Support Facilities, Offshore Facility (Proposed) etc. here.
Slide 21: This slide presents Geographic Expansion – Inorganic Opportunity displaying- Location, Infrastructure, Key Points, Overview, Benefits, Current Status and Process Going Forward.
Slide 22: This slide shows Emphasis Geographic & Product Expansion displaying- Diversification, Investment Benefits, Location Benefits, Cultural Benefits, Financial Benefits, Stable Infrastructure, Better Logistics. Adding few success stories with the investors will grab their eyeballs and further support your pitch.
Slide 23: This slide shows Company XX Has Wide Range Of Products/Services diasplaying- Product Segment, Customers preferring Segment, Product mix by Customer Segments. Adding few success stories with the investors will grab their eyeballs and further support your pitch.
Slide 24: This is …along with Superior Technical Capabilities slide displaying Capabilities.
Slide 25: This is …and state of the Art Infrastructure/ Manufacturing slide showcasing relative imagery to display.
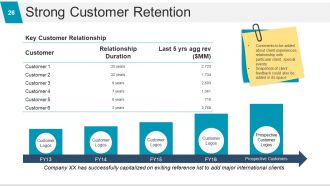
Slide 26: This slide shows Strong Customer Retention displaying- Prospective Customers, Customer, Relationship Duration, Last 5 yrs Avg. Rev. ($MM), Key Customer Relationship. Comments to be added about client experiences, relationship with particular client, special events Snapshots of client feedback could also be added in this space.
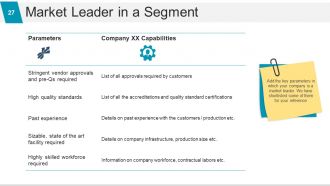
Slide 27: This slide showcases Market Leader in a Segment displaying- Parameters: High quality standards, Past experience, Sizable, state of the art facility required, Highly skilled workforce required, Stringent vendor approvals and pre-Qs required AND. Capabilities: List of all the accreditations and quality standard certifications, Details on past experience with the customers / production etc. Details on company infrastructure, production size etc. Information on company workforce, contractual labors erc. List of all approvals required by customers. Add the key parameters in which your company is a market leader. We have shortlisted some of them for your reference.
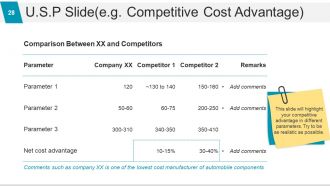
Slide 28: This slide shows Competitive Cost Advantage in tabular form displaying- Parameter, Remarks, Comparison Between XX and Competitors. This slide will highlight your competitive advantage in different parameters. Try to be as realistic as possible.
Slide 29: This slide showcases Competitive Landscape showing- Industry Segment, Direct Competitors, and Indirect Competitors.
Slide 30: This slide showcases Product Comparison in tabular form showing- Indirect Competitor, Company and Features.
Slide 31: This is a SWOT Analysis slide.
Slide 32: This side presents Technology Trend showcasing- Advantages of using technology XYZ over other players, Parameters. Show the pattern in which technology has changed in this industry and how you adapted yourself with this change. Conclusion of using this technology can also be stated here.
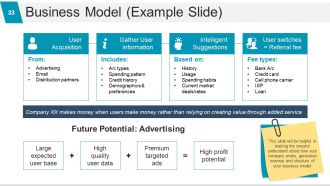
Slide 33: This is a Business Model slide displaying- User Acquisition Gather User information Intelligent Suggestions User switches = Referral fee with Future Potential: Advertising aspects to state.
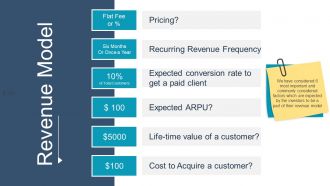
Slide 34: This is a Revenue Model slide showing- Pricing, Recurring Revenue Frequency, Expected ARPU, Life-time value of a customer, Cost to Acquire a customer. We have considered 6 most important and commonly considered factors which are expected by the investors to be a part of their revenue model.
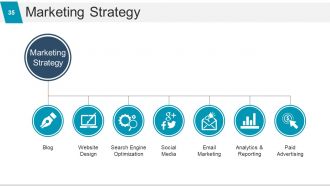
Slide 35: This slide presents Marketing Strategy consisting of- Website design, Analytics and reporting, Email marketing, Social media, Paid advertising, Collaboration, Blog, Search engine optimization.
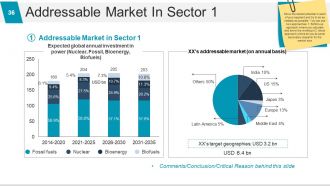
Slide 36: This slide presents Addressable Market In Sector 1 in chart and graph forms. Show the market potential in each of your segment and try to be as realistic as possible. You can use two approaches: 1. Bottom-up approach where you calculate and show the working or 2. direct approach where do you do some secondary research for the market size.
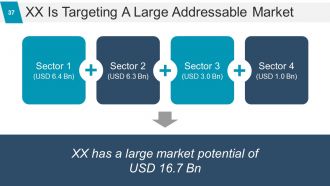
Slide 37: This slide presents Xx is Targeting a large Addressable Market in tabular box form.
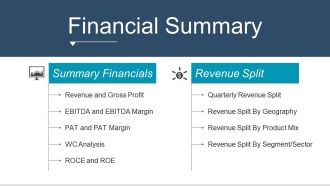
Slide 38: This slide shows Financial Summary divided into- Summary Financials: Revenue and Gross Profit, EBITDA and EBITDA Margin, PAT and PAT Margin, WC Analysis, ROCE and ROE. Revenue Split: Quarterly Revenue Split, Revenue Spilt By Geography, Revenue Split By Product Mix, Revenue split by Segment/Sector.
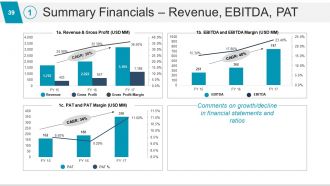
Slide 39: This slide showcases Summary financials – Revenue, EBITDA, PAT in graph form.
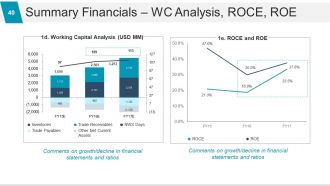
Slide 40: This slide showcases Summary financials – WC Analysis, ROCE, ROE in graph form.
Slide 41: This slide showcases Revenue Split – By Quarter & Geography in two graph forms stating- Revenue Split by Quarter, Revenue Split by Geography.
Slide 42: This slide showcases Revenue Split – By Product And Segment in graph form.
Slide 43: This is a Client Testimonials slide with name, designation and text boxes to state information.
Slide 44: This is a Contact Details slide with name, designation and text boxes to state information.
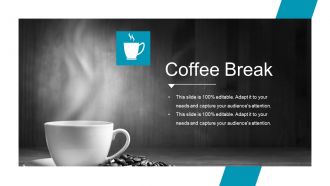
Slide 45: This is a Coffee Break slide to halt. You may change the slide content as per need.
Slide 46: This is an Investor Pitch Deck Icon Slide. Use the icons as per need.
Slide 47: This is also an Investor Pitch Deck Icon Slide. Use the icons as per need.
Slide 48: This slide is titled Our Charts and Graphs to proceed forward. You may change the slide content as per need.
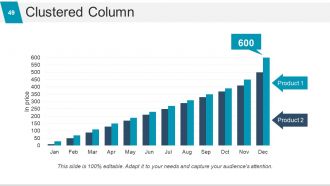
Slide 49: This slide presents a Clustered Column Chart for two product/entity comparison, information, specifications etc.
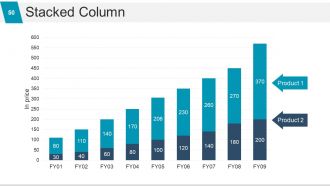
Slide 50: This slide presents a Stacked Column Chart for two product/entity comparison, information, specifications etc.
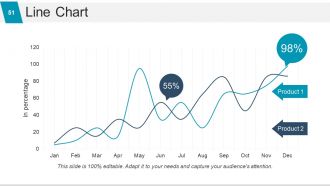
Slide 51: This slide shows a Line Chart for two product/entity comparison, information, specifications etc.
Slide 52: This slide showcases a Stacked Line with Markers Chart for two product/entity comparison, information, specifications etc.
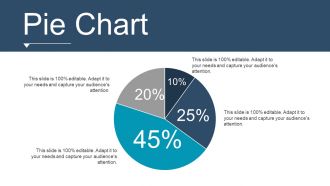
Slide 53: This slide presents a Pie Chart for two product/entity comparison, information, specifications etc.
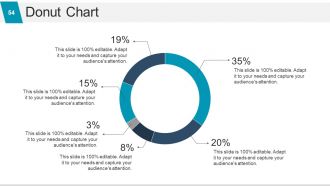
Slide 54: This slide presents a Donut Chart for two product/entity comparison, information, specifications etc.
Slide 55: This slide displays a Clustered Bar Chart for two product/entity comparison, information, specifications etc.
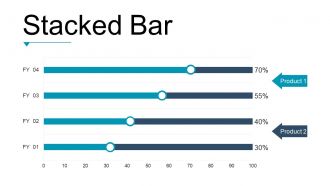
Slide 56: This slide shows a Stacked Bar Chart for two product/entity comparison, information, specifications etc.
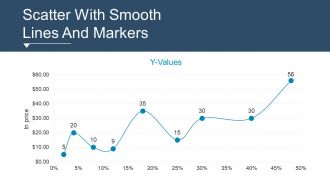
Slide 57: This slide presents a Scatter With Smooth Lines And Markers Chart for two product/entity comparison, information, specifications etc.
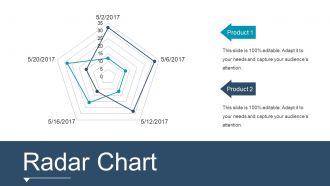
Slide 58: This slide showcases a Radar Chart for two product/entity comparison, information, specifications etc.
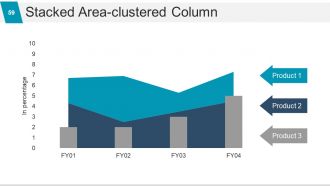
Slide 59: This slide presents a Stacked Area-clustered Column graph for two product/entity comparison, information, specifications etc.
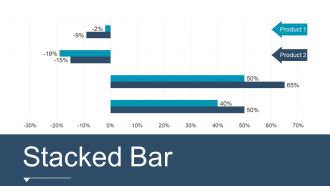
Slide 60: This slide displays a Stacked Bar Chart for two product/entity comparison, information, specifications etc.
Slide 61: This slide is titled Additional slides to proceed forward. You may change the slide content as per need.
Slide 62: This slide contains Our Mission with imagery. State it here.
Slide 63: This slide presents Meet Our Team with designation, image text holder and text boxes to fill information.
Slide 64: This is an About Us slide. State your position, facts, team/company specifications or anything business here.
Slide 65: This is Our Goals slide. State your goals etc. here.
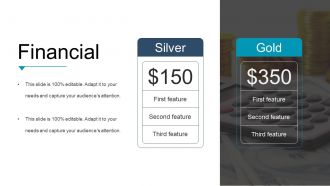
Slide 66: This slide shows Financial Score. State financial aspects here.
Slide 67: This is a Quotes slide. State business message, beliefs etc. here.
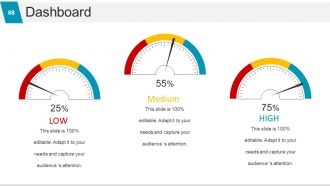
Slide 68: This is a Dashboard slide to display metrics, kpis, etc.
Slide 69: This is a Location slide of a world map image to show global growth, presence etc.
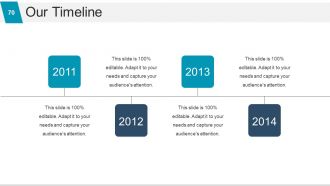
Slide 70: This is Our Timeline slide to show growth, evolution, highlighting factors etc.
Slide 71: This is also Our Timeline slide to show growth, evolution, highlighting factors etc.
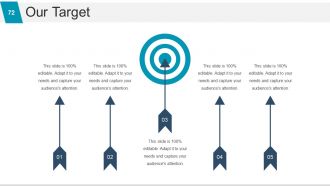
Slide 72: This is Our Target slide. State targets, aspirations etc. here.
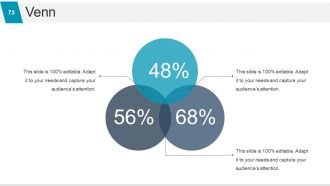
Slide 73: This slide shows a Venn diagram image with text boxes. State information, specifications etc. here.
Slide 74: This is a Mind Map Chart to show information, segregations, specifications etc.
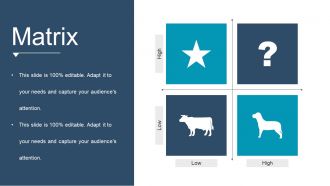
Slide 75: This is a Matrix slide to show information, specifications etc.
Slide 76: This is a Hierarchy slide to state team specifications, organizational structure etc.
Slide 77: This is a Magnifying Glass image slide to show information, specifications etc.
Slide 78: This slide shows a Bulb or Idea image with text boxes. State information, innovative aspects etc. here.
Slide 79: This slide displays a Funnel image. State information, funneling aspects etc. here.
Slide 80: This is a Thank You slide with Address# street number, city, state, Contact Numbers, Email Address.
Investor Pitch Deck Pe Powerpoint Presentation Slides with all 80 slides:
Avoid any haggling with our Investor Pitch Deck Pe Powerpoint Presentation Slides. Get them to believe in your fairness.
-
Investor Pitch
-
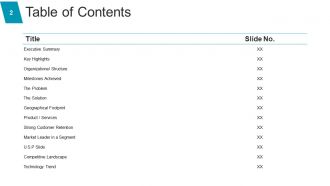
Table of Contents
-
Investor Pitch Pe Slide03
-
Executive Summary
-
Key Highlights
-
The Problem
-
The Solution
-
XX has a Well Planned Growth Strategy
-
Growth Strategy Summarized
-
Financial Projections P L
-

Financial Projections Balance Sheet
-
Financing
-
Use Of Funds
-
Goals of Funding
-
Shareholding Pattern
-
Shareholding Pattern
-
Exit Strategy
-
Organization Chart
-
Milestone Achieved
-
Geographical Footprint
-
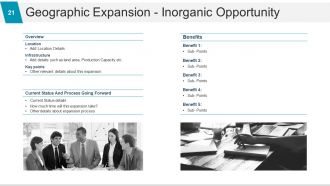
Geographic Expansion Inorganic Opportunity
-
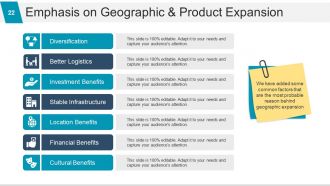
Emphasis on Geographic Product Expansion
-
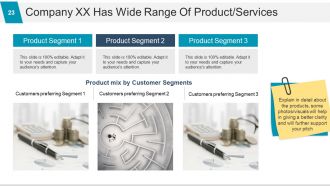
Company XX Has Wide Range Of Product Services
-
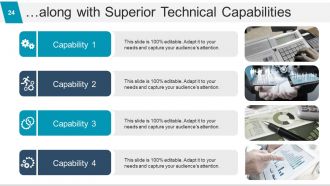
Along with Superior Technical Capabilities
-
State of the Art Infrastructure Manufacturing
-
Strong Customer Retention
-
Market Leader in a Segment
-
U S P Slide e g Competitive Cost Advantage
-
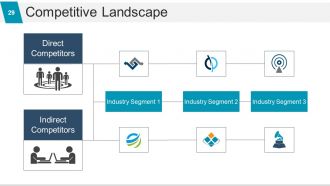
Competitive Landscape
-
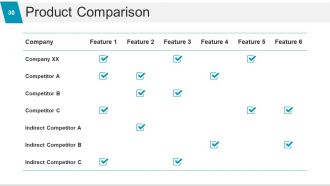
Product Comparison
-
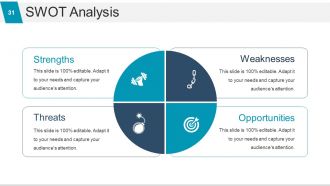
SWOT Analysis
-
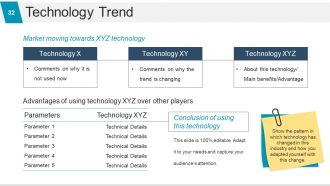
Technology Trend
-
Business Model Example Slide
-
Revenue Model
-
Marketing Strategy
-
Addressable Market In Sector 1
-
XX Is Targeting A Large Addressable Market
-
Financial Summary
-
Summary Financials Revenue EBITDA PAT
-
Summary Financials WC Analysis ROCE ROE
-
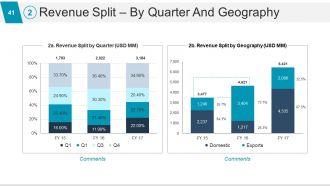
Revenue Split By Quarter And Geography
-
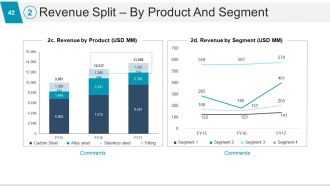
Revenue Split By Product And Segment
-

Client Testimonials
-
Contact Details
-
Coffee Break
-
Investor Pitch Deck Icon Slide
-
Investor Pitch Deck Icon Slide
-

Our Charts Graphs
-
Clustered Column
-
Stacked Column
-
Line Chart
-

Stacked Line With Markers
-
Pie Chart
-
Donut Chart
-

Clustered Bar
-
Stacked Bar
-
Scatter With Smooth Lines And Markers
-
Radar Chart
-
Stacked Area clustered Column
-
Stacked Bar
-

Additional Slides
-

Our Mission
-

Meat Our Team
-

About Us
-
Our goals
-
Financial
-

Investor Pitch Pe Slide67
-
Dashboard
-

Location
-
Our Timeline
-
Investor Pitch Pe Slide71
-
Our Target
-
Venn
-

Mind Map
-
Matrix
-
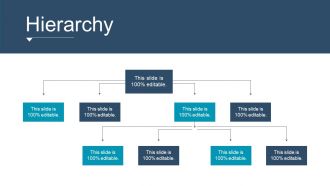
Hierarchy
-
Magnifying Glass
-
Investor Pitch Pe Slide78
-
Funnel
-

Thank You Slide
FAQs for Investor Pitch Deck Pe
So for your pitch deck, hit these must-haves: problem, solution, market size, business model, traction, competition, team, and financials. Oh and definitely include a "why now" slide - investors eat that timing stuff up. Keep it tight at 10-12 slides max, though you can always throw extra stuff in an appendix. The whole thing should flow like a story from problem to why you're the team that'll crush it. Your traction slide needs real numbers even if they're tiny - don't make stuff up. Practice until you're not just reading off the slides like a robot. Actually, I probably over-practiced mine but whatever worked I guess.
Dude, nobody wants to sit through another slideshow of boring charts and bullet points. Your pitch needs a story that actually hooks people. Start with the problem that made you go "screw this, I'm building something better." Then walk them through your journey - like you're telling a friend why you quit your day job for this crazy idea. Honestly, investors hear 50 pitches a week, so yours better stick. Stories do that. They help people picture your success instead of just reading about market size or whatever. Thread that narrative through everything - don't just dump features on them.
Keep it simple with high-contrast visuals that actually help your story. Big fonts are your friend—nobody wants to squint at tiny text. Stick to 2-3 colors max and make your charts clean but punchy. Show clear trends, not crazy detail that'll confuse people. Product screenshots are gold if you've got them, investors eat that stuff up. White space is clutch for keeping things readable. Oh, and test how everything looks on different screens since their projector might be ancient. You want people following along easily, not getting lost in visual chaos.
Hey! So for pitch decks, aim for 10-20 minutes - honestly 10-12 is perfect. You'll want time for questions after since that's where investors actually engage. I've watched so many founders bomb by cramming 30 slides in there and losing everyone's attention. Stick to 10-15 slides max. Hit the basics: problem, solution, market size, traction, your team, money stuff. Practice your timing because you'll definitely talk faster when you're nervous (we all do). Oh and make sure your ask is crystal clear at the end. Then brace yourself - the questions can get pretty intense.
Honestly, the biggest thing is cramming way too much text on slides - nobody wants to read a novel while you're talking. Skip being vague about market size too, that drives investors crazy. Oh, and never say you don't have competition (you absolutely do). I see people burn half their pitch on random product features instead of explaining how they'll actually make money. Keep it tight - maybe 10-12 slides tops. Practice your timing so you're not rushing through the important stuff at the end. Always finish with a specific ask, whether it's funding or just scheduling another meeting.
Don't just dump all your market research on one slide - that's boring as hell. Spread it around instead. Your market size slide needs TAM/SAM data to show the opportunity. Then work customer insights into your problem/solution sections so investors know you actually get your users. Competitive analysis should cover market positioning too. Growth projections work great on your traction slide. Honestly, I've seen too many decks that just list stats without context. Make the data tell a story. Pick maybe 3-4 really compelling data points that back up why someone should invest in you.
Look, investors really want to see your traction numbers - MRR, customer acquisition cost, and growth rate. Those three are like gold. User engagement and retention rates? Super important too, especially if you're doing SaaS. Burn rate always stresses me out when I'm looking at pitch decks, but you gotta show them you get your cash situation. Market size helps tell the bigger story. Oh and don't dump every metric you've ever tracked on them - pick maybe 3-5 that actually show your growth trajectory. Quality over quantity, you know?
Honestly, your biggest mistake would be burying the actual problem you're solving. Jump straight into a pain point everyone in that room has felt - make them think "ugh yes, this drives me crazy too." Then show your solution side-by-side with whatever garbage exists now. Skip the whole "we're 10x faster" thing and just demo it. I've seen too many decks that try to cram in every single feature when really you just need that one killer thing that makes people go "damn, that's smart." The goal is getting investors to nod along thinking yeah, I actually need this.
Oh man, design matters SO much for pitch decks. Bad visuals will kill even the best ideas - I've watched investors mentally check out the second they see messy slides. You want clean fonts, good white space, maybe some simple charts. Nothing too flashy though, like those decks with crazy animations everywhere (so cringey). Professional design basically tells investors you pay attention to details and aren't just winging it. Keep everything consistent and let your actual points shine through instead of fighting with weird formatting.
Basically, you gotta shift your pitch depending on who you're talking to. VCs are all about that massive market opportunity - hit them with your TAM and growth numbers right away. Angels though? They're betting on YOU more than anything, so start with your founder story and why you're the one to pull this off. Strategic investors are different - they want to see how you fit into what they're already doing. Same deck, just rearrange what you emphasize first. Oh and definitely stalk their recent investments beforehand so you can name-drop similar companies in their portfolio. Makes you look like you actually did your homework.
Honestly, just focus on the big three: revenue, gross margin, and customer acquisition costs. Charts work way better than spreadsheets - nobody wants to decode tiny numbers during your pitch. Go out 3-5 years but let's be real, years 4-5 are pretty much wild guesses anyway. The key thing? Show your assumptions behind everything and be ready to explain them. If you can swing it, do three scenarios - base case, optimistic, and conservative. Investors actually respect when you're not just painting everything super rosy. Oh, and definitely practice defending those numbers because they'll grill you on them.
Don't just throw job titles on your team slide - that's basically useless. Lead with what each person actually *did* that makes them perfect for your specific problem. Like, instead of "10 years at Google," say "built Google's payment system that processed $2B." Focus on 2-3 key people max and cover the roles you actually need to win. Previous exits are gold if you have them. Oh, and add one line about why each person gives a damn about this particular mission - investors eat that stuff up because it shows they won't bail when things get tough.
Look, investors aren't idiots - they'll spot the risks anyway, so don't try hiding them. Pick your 2-3 biggest ones (market competition, regulatory stuff, whatever) and own them upfront. But here's the thing: immediately follow with your actual plan to handle it. Not some vague "we'll figure it out" nonsense, but real strategies. I've seen too many founders act like their startup exists in some risk-free bubble and it's painful to watch. Show them you're thinking ahead without sounding paranoid. Stick this on a slide near the end, right before you ask for money.
Don't dump all your case studies on one slide - that's boring as hell. Sprinkle them throughout instead. Throw a customer quote on your problem slide to show the pain is real. Then hit them with hard numbers in your traction section: "Company X saw 40% revenue growth in 6 months." Keep testimonials punchy - nobody's reading War and Peace in a pitch deck. Match each story to whatever point you're making right then. The whole idea is getting investors to think "okay, if it worked for them, it'll definitely work for others." Makes your solution feel proven, not theoretical.
PowerPoint's probably your safest bet if you want maximum control over everything. Google Slides works great too, especially since you can collaborate easily (and it's free obviously). Honestly though? Canva might be your move if design isn't your thing - their investor templates are actually pretty solid and way better than starting from zero. I've seen some really clean decks come out of there. Just keep it simple no matter what you use. One main point per slide, don't go crazy with animations. The story you're telling matters way more than flashy transitions anyway.
-
Nice and innovative design.
-
It saves your time and decrease your efforts in half.