


Post IPO Market Pitch Deck Powerpoint Presentation Slides





Try Before you Buy Download Free Sample Product
 Impress Your
 Audience
 100%
100% Editable
 Save Hours
 of Time


Our Post IPO Market Pitch Deck Powerpoint Presentation Slides are topically designed to provide an attractive backdrop to any subject. Use them to look like a presentation pro.
People who downloaded this PowerPoint presentation also viewed the following :
Content of this Powerpoint Presentation
Slide 1: This is the cover slide for Post IPO Market (Pitch Deck) PowerPoint Presentation.
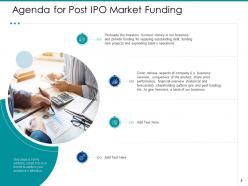
Slide 2: This is the Agenda for Post IPO Market Funding slide.
Slide 3: This is a Table of Contents slide that lists out all the essential elements covered in the deck.
Slide 4: This is a Table of Contents slide that lists out all the essential elements covered in the deck.
Slide 5: The slide provides a brief overview of the company’s operations (introduction, mission and vision statement) and financials (Revenue, EBIT, Net income and Non-Performing Assets)
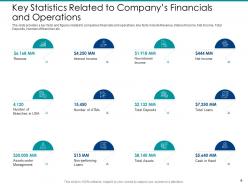
Slide 6: The slide provides a key facts and figures related to companies financials and operations. Key facts include Revenue, Interest Income, Net Income, Total Deposits, Number of Branches etc.
Slide 7: The slide explains the key problems faced by the customers and the solutions (for those problems) which the company offers through its products
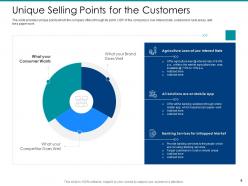
Slide 8: The slide provides unique points which the company offers through its point. USP of the company is: low interest rate, solutions in rural areas; and less paper work
Slide 9: The slide provides a key products and services of the company, which it offers under different product categories i.e. Individuals; Business/SMEs; and Corporates
Slide 10: The slide covers all the major historic events of the company including founding, major acquisition, new product launch, partnership, expansion etc.
Slide 11: The slide covers the key Recognitions of the company such as awards, milestone related to revenue & user base, rating, certification etc.
Slide 12: The slides covers the key points to explain the business model of the company. Key points include: our client. core business analytics; key products; business partners; cost structure, revenue sources etc.
Slide 13: The slide provides the details about major sources of revenue i.e. interest on loan, investment income, fee income etc.
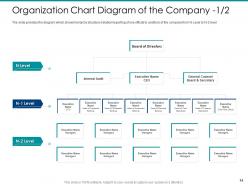
Slide 14: The slide provides the diagram which shows hierarchy structure (relation/reporting of one official to another) of the company from N Level to N-2 level
Slide 15: The slide provides the diagram which shows ownership structure (holding and subsidiary companies) of the company. The structure includes holding company, sister subsidiaries and subsidiaries of our company
Slide 16: The slide provides the name, designation and brief biography of key senior level executives (C-level employees and head of Departments)
Slide 17: The slide provides the line chart of stock price of the company in last five years. It also states the reason for drastic decline of price
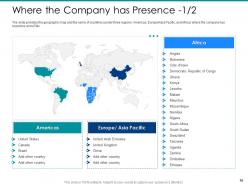
Slide 18: The slide provides the geographic map and the name of countries (under three regions: Americas, Europe/Asia Pacific, and Africa) where the company has branches and ATMs
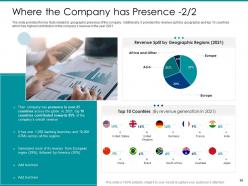
Slide 19: The slide provides the key facts related to geographic presence of the company. Additionally, it provides the revenue split (by geography) and top 10 countries which has highest contribution in the company’s revenue in the year 2021
Slide 20: The slide provides the key step/strategies which the company follows to strengthen its presence in new countries. Key strategies include: new branch opening, acquisition, and introducing new products
Slide 21: The slide covers key strategic steps which the company follows for its future growth. Major strategies includes, Agreements, Digital marketing, product differentiation
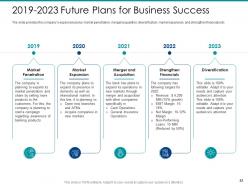
Slide 22: The slide provides the company’s expansion plans: market penetration, merger/acquisition, diversification, market expansion, and strengthen financials etc.
Slide 23: The slide provides the historical (2015-2019) and forecasted (2020-2024) market size of the banking industry. It also provides the key facts and 2021 market share of top companies in US banking industry
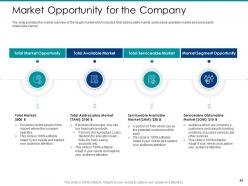
Slide 24: The slide provides the market overview of the target market which includes total addressable market, serviceable available market and serviceable obtainable market.
Slide 25: The slide provides the market size of all the target sectors. Additionally, it provides overall market potential and highlight of target audience
Slide 26: The slide provides the segmentation about the target customers of the company by geography (country, area, climate), Demography (Age, gender, Nationality etc.), and Psychography (Personality, values, interest etc.) and behaviour (brand loyalty, user status, occasion etc.)
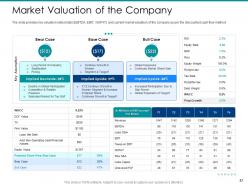
Slide 27: The slide provides key valuation ratios/stats (EBITDA, EBIT, NOPAT) and current market valuation of the company as per the discounted cash flow method
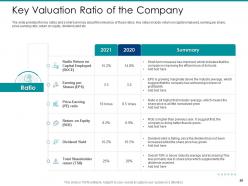
Slide 28: The slide provides the key ratios and a brief summary about the relevance of those ratios. Key ratios include: return on capital employed, earning per share, price-earning ratio, return on equity, dividend yield etc.
Slide 29: The slide provides the key ratios and a brief summary about the relevance of those ratios. Key ratios include: return on capital employed, earning per share, price-earning ratio, return on equity, dividend yield etc.
Slide 30: The slide provides the key competitors of the company in different operations i.e. banking, insurance, asset management and other businesses
Slide 31: The slide provides relative valuation of the company comparing to its competitors. It provides comparison on the basis of share price, market capitalization, enterprise value, Price-Earning (PE) ratio; EV/EBITDA ratio.
Slide 32: The slide provides the Competitive landscape of the company on the basis of products’ features i.e. online availability, cost, customers, criteria etc.
Slide 33: The slide provides the Competitive landscape of the company on the basis of company’s size i.e. number of users, revenue, employee count, app downloads, user traffic, social media followers etc.
Slide 34: The slide provides the Competitive landscape of the company on the basis of financial data (sales and profit) and operational data (employee count, locations, number of branches, year of existence, interest rate etc.)
Slide 35: This slide presents details on major goal of secondary funding.
Slide 36: The slide provides the details about use of funding. The company spend its funding amount on new hiring, pay off debt, provide subsidy, expansion etc.
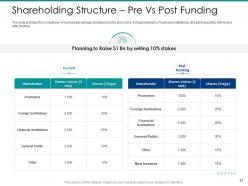
Slide 37: The slide provides the comparison of number/percentage of shares (hold by promotors, Foreign investors, Financials institutions, and general public) before and after funding
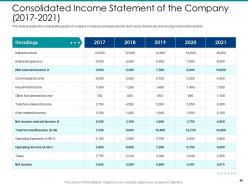
Slide 38: The slide provides the financials highlight of the company including: revenue and net interest income for five years; and revenue split by segments and geographic area
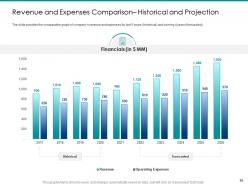
Slide 39: The slide provides the comparative graph of company’s revenue and expenses for last 5 years (historical) and coming 4 years (forecasted)
Slide 40: The slide provides the comparative graph of company’s revenue and expenses for last 5 years (historical) and coming 4 years (forecasted)
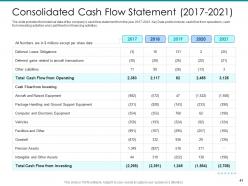
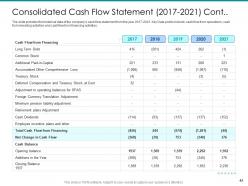
Slide 41: The slide provides the historical data of the company’s cash flow statement from the year 2017-2021. Key Data points include: cash flow from operations, cash from investing activities and cashflow from financing activities.
Slide 42: The slide provides the historical data of the company’s cash flow statement from the year 2017-2021. Key Data points include: cash flow from operations, cash from investing activities and cashflow from financing activities.
Slide 43: The slide provides the historical data of the company’s balance sheet from the year 2017-2021. Key Data points include: total current assets, fixed assets, total assets, current and long-term labilities etc.
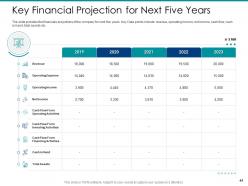
Slide 44: The slide provides the financials projections of the company for next five years. Key Data points include: revenue, operating income, net income, cash flow, cash in hand, total assets etc.
Slide 45: The slide provides the revenue projections of the company for next five years. Key Data points include: Interest income, investment income, commission income, non-interest income etc.
Slide 46: The slide provides the client’s person reviews about the products and services of the company.
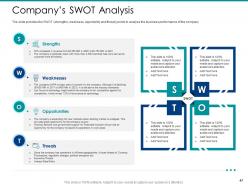
Slide 47: The slide provides the SWOT (strengths, weakness, opportunity and threat) points to analyse the business performance of the company
Slide 48: The slide provides most profitable/feasible ways for investors to exit from their investment in the company. It includes IPO, merger, private offerings, acquisition by venture capital firm etc.
Slide 49: This is an Icon slide. Use it as per your needs.
Slide 50: This is an Additional Slide.
Slide 51: This is an Area Chart slide that can be used to compare different products.
Slide 52: This is a Line Chart slide that can be used to compare different products.
Slide 53: This is a Column Chart slide that can be used to compare different elements.
Slide 54: This is a Financial score slide that can be used to jot down financial aspects of your company.
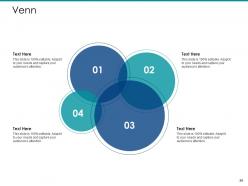
Slide 55: This is a Venn diagram slide that can be used to compare three different elements.
Slide 56: This a Magnifying Glass slide that can be used to highlight important points.
Slide 57: This is a creative Puzzle slide that can be used to present creative ideas.
Slide 58: This is a Post It Notes slide that can be used to keep important information at one place.
Slide 59: This is a Timeline slide that can be used to present chronological sequence of events.
Slide 60: This is a Silhouettes slide that can be used for any logo design.
Slide 61: This is a Thank You slide for acknowledgment. You can share your contact details here.
Post IPO Market Pitch Deck Powerpoint Presentation Slides with all 61 slides:
Use our Post IPO Market Pitch Deck Powerpoint Presentation Slides to effectively help you save your valuable time. They are readymade to fit into any presentation structure.
























FAQs for Post IPO Market Pitch Deck
Strong post-IPO performance indicators include sustained stock price growth, consistent revenue increases, expanding market share, improved operational efficiency, and robust investor confidence. These metrics work together by demonstrating scalability and strategic execution, with many technology and healthcare companies finding that maintaining growth momentum while delivering enhanced shareholder value ultimately establishes long-term market credibility.
Investor sentiment significantly influences post-IPO stock prices through market psychology, media coverage, analyst recommendations, and trading volume patterns. Positive sentiment often drives prices above fundamental valuations, while negative perceptions can create undervaluation opportunities, with many institutional investors finding that emotional market reactions present strategic entry points for long-term value creation.
Underwriters stabilize post-IPO markets through price support mechanisms, over-allotment options, and strategic market interventions during the initial trading period. These financial institutions manage volatility by purchasing shares when prices decline below offering levels, coordinating with institutional investors, and providing liquidity support, ultimately delivering smoother price discovery and enhanced investor confidence.
Companies can effectively communicate with investors after going public through regular earnings calls, comprehensive quarterly reports, investor relations websites, and proactive stakeholder engagement strategies. These communication channels streamline transparency by providing consistent financial updates, strategic roadmaps, and performance metrics, while enabling public companies to build investor confidence, manage market expectations, and ultimately maintain strong stock valuations in an increasingly competitive post-IPO landscape.
Lock-up periods significantly influence post-IPO trading by restricting insider and early investor sales for typically 90-180 days, creating artificial scarcity that can inflate stock prices. As lock-up expiration approaches, markets often experience increased volatility and selling pressure, with many institutional investors strategically timing their positions around these periods to capitalize on price movements and liquidity changes.
Economic conditions significantly influence post-IPO performance through interest rates, investor sentiment, market volatility, and sector-specific demand fluctuations. During favorable conditions, newly public companies often experience enhanced valuations and improved access to capital, while economic uncertainty can create pricing pressures, ultimately affecting growth trajectories and long-term market positioning.
Companies manage post-IPO volatility through strategic communication, earnings guidance management, investor relations programs, liquidity management, and selective secondary offerings. These approaches work by maintaining transparent stakeholder dialogue, stabilizing price expectations, and building institutional confidence, with many newly public companies finding that consistent quarterly communication and proactive market education ultimately deliver reduced share price fluctuations and stronger investor relationships.
Establishing strong brand presence post-IPO is crucial for maintaining investor confidence, attracting institutional investment, and differentiating from competitors in public markets. Companies with robust post-IPO branding strategies streamline market positioning, enhance stakeholder trust, and accelerate customer acquisition, with many finding that immediate brand investment delivers sustained stock performance and competitive advantage.
Common pitfalls include managing increased regulatory compliance costs, maintaining growth momentum under public scrutiny, balancing short-term investor expectations with long-term strategy, adapting leadership to public company governance, and effectively communicating with analysts and institutional investors. These challenges often overwhelm newly public companies through inadequate investor relations, missed earnings guidance, and operational inefficiencies, with many organizations finding that proactive compliance systems and strategic communication ultimately deliver sustained market confidence and competitive positioning.
Institutional investors approach post-IPO stocks through comprehensive due diligence, large-scale positions, and long-term strategic analysis, while retail investors typically make smaller, emotion-driven decisions based on market sentiment and limited research. Through sophisticated risk management and direct company access, institutional investors can weather post-IPO volatility more effectively, ultimately delivering more consistent returns and strategic portfolio positioning.
**INPUT**: What factors contribute to the long-term sustainability of stock prices after an IPO? **OUTPUT**: Long-term stock price sustainability depends on consistent revenue growth, strong management execution, market expansion capabilities, competitive positioning, and transparent financial reporting. Companies like Apple, Amazon, and Microsoft demonstrate how strategic innovation, operational efficiency, and stakeholder trust ultimately deliver sustained value, with many successful post-IPO organizations finding that balancing growth investments with profitability creates lasting competitive advantage. [Word count: 57 words]
Transparent financial reporting practices significantly influence post-IPO investor confidence by demonstrating accountability, providing accurate performance metrics, and ensuring regulatory compliance through consistent disclosure standards. Companies with robust reporting frameworks, like those seen in technology and healthcare sectors, typically experience stronger investor trust and stock price stability, while poor practices can lead to volatility and reduced market confidence.
Secondary offerings enable post-IPO companies to raise additional capital for expansion, debt reduction, acquisitions, and strategic investments while providing existing shareholders liquidity opportunities. These offerings enhance operational flexibility, accelerate growth initiatives, and strengthen balance sheets, with many technology and healthcare companies finding that strategic secondary offerings deliver competitive advantages and fuel long-term market positioning.
Competitive dynamics significantly influence post-IPO performance through market share pressures, pricing power, and differentiation challenges, with intense competition often constraining revenue growth and margin expansion. Companies in fragmented industries like fintech or healthcare technology typically face ongoing valuation pressures, while those with strong competitive moats deliver sustained performance, ultimately determining long-term investor confidence and stock appreciation.
Technology revolutionizes post-IPO investor interactions through real-time analytics, automated reporting systems, digital communication platforms, and AI-driven sentiment analysis. These innovations enable companies to deliver faster quarterly updates, personalized investor communications, and data-driven market insights, while institutional investors leverage algorithmic trading and predictive modeling, ultimately enhancing transparency and strategic decision-making.
-
Presentation Design is very nice, good work with the content as well.
-
Easily Understandable slides.
-
The Designed Graphic are very professional and classic.