

Jira dashboard for software development project software development best practice tools




Try Before you Buy Download Free Sample Product
 Impress Your
 Audience
 100%
100% Editable
 Save Hours
 of Time


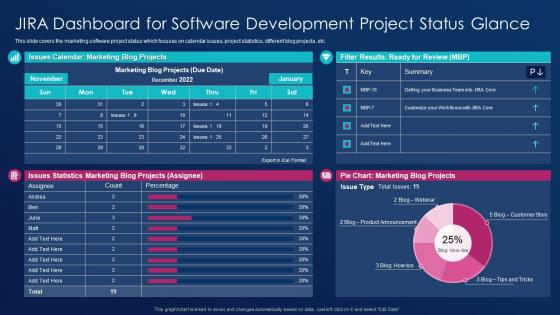
This slide covers the marketing software project status which focuses on calendar issues, project statistics, different blog projects, etc.
People who downloaded this PowerPoint presentation also viewed the following :
Jira dashboard for software development project software development best practice tools with all 7 slides:
Use our Jira Dashboard For Software Development Project Software Development Best Practice Tools to effectively help you save your valuable time. They are readymade to fit into any presentation structure.





FAQs for Jira dashboard for software development project software development
Effective Jira dashboards include sprint burndown charts, velocity metrics, issue tracking summaries, project progress indicators, and team workload distributions. These components streamline project visibility by monitoring development cycles, identifying bottlenecks, and tracking delivery timelines, with many software teams finding that centralized dashboards enhance collaboration and accelerate release schedules.
Custom dashboards in Jira enhance team collaboration by providing shared visibility into project status, sprint progress, bug tracking, and individual workloads through centralized, real-time reporting. These dashboards streamline communication by enabling development teams, QA engineers, and project managers to access consistent information simultaneously, ultimately reducing status meetings and email exchanges while improving transparency across software development lifecycles.
Essential Jira dashboard metrics include sprint burndown charts, velocity tracking, defect density rates, cycle time analysis, and story point completion ratios. These metrics streamline project visibility by monitoring team productivity, identifying bottlenecks, and forecasting delivery timelines, with many development teams finding that comprehensive dashboard tracking ultimately enhances sprint planning accuracy and accelerates release cycles.
Jira filters enable targeted dashboard views by segmenting issues through criteria like assignee, status, priority, project, and sprint, creating focused perspectives for specific teams or workflows. These customized filters streamline project tracking by highlighting critical bottlenecks, upcoming deadlines, and team workloads, with many development teams finding that strategic filter combinations ultimately enhance sprint planning and resource allocation efficiency.
Widgets enable project managers to customize Jira dashboards by displaying relevant metrics, progress tracking, and team performance data tailored to specific project requirements. Through configurable widgets like burndown charts, sprint reports, and issue statistics, development teams can monitor code quality, track delivery timelines, and identify bottlenecks, ultimately enhancing project visibility and accelerating development cycles.
Jira dashboards integrate with software development tools through APIs, native connectors, and third-party applications like Confluence, Bitbucket, Jenkins, Slack, and GitHub. These integrations streamline workflows by enabling automated ticket creation, real-time status updates, and centralized reporting, with many development teams finding that consolidated visibility across tools enhances collaboration and accelerates delivery cycles.
Best practices for designing user-friendly Jira dashboards include prioritizing relevant metrics, customizing layouts for specific roles, utilizing clear visual hierarchies, implementing effective filtering options, and ensuring mobile responsiveness. These approaches streamline project visibility by reducing information overload, enhancing team collaboration, and enabling faster decision-making, with many development teams finding that well-designed dashboards ultimately deliver improved productivity and better project outcomes.
Agile teams can utilize Jira dashboards by tracking sprint burndown charts, velocity metrics, story completion rates, and defect trends in real-time. These visual tools enable project managers and developers to identify bottlenecks early, adjust workloads dynamically, and maintain sprint commitments, with many software teams finding that dashboard visibility ultimately enhances delivery predictability and team accountability.
Jira dashboards visualize bug tracking and resolution rates through sprint burndown charts, bug resolution time gadgets, created vs. resolved issues reports, and cumulative flow diagrams. These visualization tools enable development teams to monitor defect trends, identify bottlenecks in resolution workflows, and track team performance metrics, ultimately delivering faster bug fixes and improved software quality.
Project managers benefit from dashboards focused on sprint progress, team velocity, burndown charts, issue distribution across team members, and deadline tracking to maintain project oversight. Developers find value in personal workload dashboards, code review queues, bug priority lists, and technical debt tracking, with many software teams discovering that customized role-specific views ultimately streamline workflows and enhance team productivity.
Jira dashboards facilitate retrospectives by displaying sprint burndown charts, velocity trends, issue resolution times, and team performance metrics in centralized visual formats. These comprehensive views enable development teams to identify bottlenecks, analyze workflow patterns, and track improvement initiatives over time, with many organizations finding that data-driven retrospectives ultimately deliver more actionable insights and sustained process enhancements.
Teams commonly face challenges like dashboard complexity overload, inconsistent data input practices, user adoption resistance, and inadequate customization for specific workflows when implementing Jira dashboards. These obstacles can be overcome by starting with simplified essential metrics, establishing clear data entry standards, providing comprehensive team training, and iteratively customizing dashboards based on user feedback, ultimately delivering improved project visibility and streamlined development processes.
Jira's automation features enhance dashboard data updates by automatically triggering field updates, transitioning issues based on conditions, and synchronizing project statuses in real-time. These automated workflows streamline data accuracy across development teams, reduce manual reporting overhead, and ensure dashboards reflect current sprint progress, with many software organizations finding that automated issue tracking delivers faster project visibility and improved team coordination.
Common pitfalls include overloading dashboards with excessive metrics, using irrelevant widgets that don't align with team goals, poor filter configuration, and neglecting user permissions management. These issues create confusion rather than clarity, with many development teams finding that focused dashboards displaying sprint progress, bug trends, and velocity metrics deliver better project visibility and faster decision-making.
Jira dashboards align development goals with business objectives by displaying key performance indicators, sprint progress, feature delivery timelines, and customer impact metrics in unified views. These visual dashboards enable product managers and executives to track development velocity against business milestones, while engineering teams can prioritize work based on strategic initiatives, ultimately delivering faster time-to-market and improved stakeholder alignment.
-
Innovative and Colorful designs.
-
Informative design.