


Jira Sprint Closure Summary Report With Velocity Chart




Try Before you Buy Download Free Sample Product
 Impress Your
 Audience
 100%
100% Editable
 Save Hours
 of Time


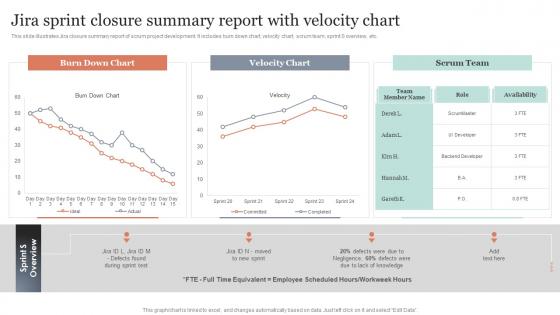
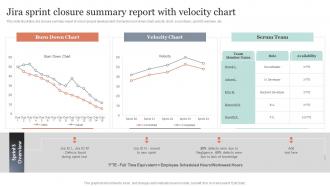
This slide illustrates Jira closure summary report of scrum project development. It includes burn down chart, velocity chart, scrum team, sprint S overview, etc.
People who downloaded this PowerPoint presentation also viewed the following :
Jira Sprint Closure Summary Report With Velocity Chart with all 7 slides:
Use our Jira Sprint Closure Summary Report With Velocity Chart to effectively help you save your valuable time. They are readymade to fit into any presentation structure.






FAQs for Jira Sprint Closure Summary Report
Definitely include your sprint goals vs what you actually finished, plus story points planned vs delivered. Break down your tickets into completed/incomplete/carry-over buckets. Velocity trends are huge - show if you're improving or struggling. Don't forget blockers and team capacity stuff. I'd add a quick retrospective highlights section too, especially for stakeholders who missed those meetings. Mid-sprint scope changes are brutal but you gotta document them and their impact. Charts work way better than paragraphs - people's eyes glaze over with too much text. The whole point is showing leadership what got done and honestly explaining what didn't.
Check your sprint reports after each one wraps up - focus on the "Completed" section. Story points work way better than counting individual tickets, trust me on that one. Just measure the same way every single time, otherwise you're basically flying blind. Don't freak out over one bad sprint though. Look at 3-4 sprints minimum to spot actual trends. That average becomes what you use for planning future sprints. I'd throw the numbers in a spreadsheet or just use Jira's velocity chart thing. Makes it super obvious when your team's getting faster or hitting roadblocks.
So for retros, stick to the classic three buckets - what worked, what sucked, and what you're gonna do next sprint. Don't write vague BS like "better communication" (ugh, hate those). Get specific action items with actual names attached and deadlines. I always screenshot the retro board too - way easier than typing everything out. The real magic happens when you start seeing patterns across multiple sprints, so track those trends. Oh and actually follow up on whether people did their action items from last time. Otherwise you're just making pretty documents that nobody reads.
The closure report is basically your sprint's report card - shows what you promised vs what actually happened. No hiding incomplete work when everything's laid out like that. Stakeholders can see real progress without constantly asking "how's it going?" (which honestly saves you so many interruptions). You'll see sprint goals, finished stories, plus any blockers that popped up. Makes it obvious who delivered what and why stuff didn't get done. I'd definitely use it in retrospectives too - helps you spot patterns and get better at planning. The transparency thing is probably the biggest win though.
Track your sprint velocity - story points you actually finished versus what you planned. Burndown charts are solid too, they show daily progress. Completion percentage of committed work is key. Oh, and definitely call out anything that spilled over to the next sprint. Your stakeholders eat up visual charts - makes them feel like they're getting the real data. Brief notes on blockers help explain why things went sideways. If someone was sick or took vacation, mention team capacity changes. Keep it visual and short though. Nobody wants to read a novel, trust me.
Look at your sprint summaries from the past 5-6 sprints and calculate your average velocity - that's your real baseline, not what you think you can crush. Check which story types always take way longer than estimated (there's always that one category that screws everyone over). Your team's actual capacity is probably lower than expected, so use that data when planning. Also scan for patterns: are certain people always swamped? Do specific blockers keep popping up? I'd pull last quarter's data first since it gives you enough context without going overboard. The historical trends will show you exactly where your estimates are off and help set realistic goals going forward.
Honestly, charts and graphs are a game-changer for sprint summaries. People's eyes just glaze over when you throw raw numbers at them. Bar charts for completed work, pie charts breaking down story points, velocity trend lines - that stuff tells the story instantly. I usually stick with maybe 2-3 visuals max because more than that gets overwhelming. Quick tip though: make sure whatever you pick actually ties back to your sprint goals. There's nothing worse than pretty charts that don't mean anything. Trust me, your retros will run so much smoother when everyone can see the patterns right away.
Include everything you worked on, even the stuff that didn't get done. Completed stories and bug fixes are obvious wins to show. But don't hide the incomplete work or blocked items - that transparency actually makes you look more credible. Honestly, stakeholders appreciate the full picture way more than just the highlight reel. Add quick notes about why things didn't finish so people aren't left wondering. Maybe something got blocked by another team, or requirements changed mid-sprint. Those details help everyone plan better for next time and show you're being real about challenges.
Look, stakeholder feedback is your sprint summary's reality check - tells you if you actually built what they wanted or if there's a disconnect. Grab their thoughts on the features you shipped. Document any concerns, changes they want, how satisfied they are overall. Honestly, the stuff that catches you off guard is usually the most helpful feedback anyway. Your retrospective needs this input since it shows the real impact of your work - not just what you think you delivered. Don't just wait around hoping they'll speak up though. You've got to actively ask for it.
Don't focus on individual sprint summaries - look for patterns across several sprints instead. I just track recurring themes in a basic spreadsheet (nothing fancy). Stuff like "estimation was way off again" or "dependencies screwed us over." You know, the same issues that keep popping up in retros. Short sentences work. Then connect what's happening between sprints to figure out if it's actually systemic or just bad luck. When you bring this to your next retrospective, having real data helps tons. It's way more convincing to say "this happened in 4 out of 6 sprints" than just venting about problems.
Honestly, tracking what everyone's doing isn't just micromanaging BS – it actually helps you spot who's crushing it versus who might be struggling. When people see their work getting recognized, they're way more motivated than you'd think. I've found it super useful during performance reviews too, since you're not just guessing about productivity. You can redistribute work better and catch bottlenecks before they blow up your sprint. Track story points or completed tasks, whatever works. The patterns you'll notice make sprint planning so much easier.
That sprint summary is actually really useful for backlog stuff - I totally slept on it for way too long. Check what keeps getting bumped to the next sprint, those stories probably need to be broken down better. Velocity trends will help you figure out if you're being realistic with story points. Technical debt shows up pretty clearly in the blocker analysis too. I mean, gut instincts are fine but having actual data makes refinement sessions so much better. If you've got epics that keep causing problems, just split them up early. Way less headache later.
So I've dealt with this same headache before - Confluence is honestly your best friend here. It's probably already part of your Atlassian setup and has these sprint report templates that just work. You can set it up to auto-generate pages when sprints wrap up, pulls all the data straight from your boards. Power BI or Tableau work too if you want something prettier and more visual. There's also Zapier or Jira's automation rules that'll trigger reports automatically. But seriously, I'd just stick with Confluence first - way less hassle than setting up integrations you don't really need.
Move those unfinished tasks straight to the product backlog. Document exactly why they didn't get done in your Sprint Closure Summary - blockers, scope creep, capacity issues, whatever it was. Just don't write "ran out of time" because honestly, that tells nobody anything useful. Break down the big unfinished stuff into smaller chunks before tossing them back. Update story points too if the scope shifted mid-sprint (which happens more than we'd like to admit). Being upfront about what went wrong helps your team spot patterns and get better at estimating velocity. Nobody likes surprises in retrospectives.
Stop letting sprint reviews turn into those boring "here's what we did" meetings. Track your velocity, completion rates, and what's blocking you - then actually USE that data to change something next sprint. Pick 1-2 concrete improvements each time and give someone ownership over them. Your Jira probably has patterns you're missing (like always underestimating UI work or whatever). Write this stuff down so you can check if your fixes worked later. Honestly, most teams just talk and never follow through. Make yours different.
-
SlideTeam makes creating presentations easy. Unlimited products, premium quality designs and affordable.
-
Great product with highly impressive and engaging designs.