

Scrum Metrics With Sprint Burndown Chart


Try Before you Buy Download Free Sample Product
 Impress Your
 Audience
Editable
of Time


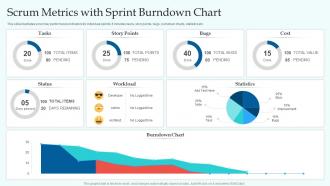
This slide illustrates scrum key performance indicators for individual sprints. It includes tasks, story points, bugs, burndown charts, statistics etc.
People who downloaded this PowerPoint presentation also viewed the following :
Scrum Metrics With Sprint Burndown Chart with all 7 slides:
Use our Scrum Metrics With Sprint Burndown Chart to effectively help you save your valuable time. They are readymade to fit into any presentation structure.


FAQs for Scrum Metrics With
Honestly, just start with three: velocity, sprint burndown, and whether you're actually hitting your sprint goals. Velocity shows how much your team can realistically handle. Burndown tracks if you're on pace day-to-day. Goal achievement is huge because - and I've seen this too many times - teams get obsessed with story points but forget if they're delivering anything useful. If you're having quality issues, maybe add cycle time and defect tracking later. But seriously, don't go dashboard crazy right away. Pick metrics that'll actually help when you're sitting in retrospectives trying to figure out what went wrong.
Just track how many story points your team finishes each sprint and plot it on a basic chart. Don't obsess over single sprints though - they're all over the place because of holidays, people getting sick, or that "easy" story that turns into a nightmare. Look at your average across 3-5 sprints instead. That'll show you real patterns. Are you guys always biting off more than you can chew? Or playing it too safe? Use this for planning your next sprint capacity, but seriously don't turn it into some performance scorecard - that's how you kill team morale. Start simple and see what trends pop up.
So burndown charts basically show if your team's gonna hit sprint goals by tracking how much work is left over time. When the line goes flat for days? That's your red flag right there - something's blocking progress. I actually love using these in standups because you get real data instead of just "yeah, things are going fine." You can see if you're ahead or behind that ideal line pretty quick. Plus they reveal team patterns - like do you always crush it at the end or kinda struggle? Super useful for deciding if you need to cut scope or get help with blockers.
So cumulative flow diagrams track how work moves through your Scrum states - you know, "To Do" to "In Progress" to "Done." Look for smooth, parallel bands. Fat sections? That's your bottleneck (code review is usually the culprit, honestly). Flat spots mean nothing's moving. The space between bands shows work-in-progress limits, while horizontal distance gives you cycle time. I'd check it weekly during retros - catches flow issues before they wreck your sprint. Way better than scrambling at the end when everything's already broken.
Think of sprint goals as your reality check for all those metrics you're tracking. Sure, you can obsess over velocity and burndown charts, but they're pretty meaningless without knowing what you're actually trying to achieve. Here's the thing - hitting your velocity means nothing if you totally whiffed on the sprint objective. That disconnect? Perfect topic for your next retro. Your sprint goal becomes this filter for everything else. Did we accomplish what we set out to do, or did we just stay busy? It's the difference between real progress and just... doing stuff. Use it to add context to all those numbers you're collecting.
So basically, track how long stuff takes from start to finish - that's your cycle time. When it's wildly inconsistent, you've probably got unclear requirements or people changing scope mid-sprint (ugh). The real trick is figuring out which stages consistently drag. Code reviews taking days? Testing always backed up? I swear, some teams obsess over this metric too much, but it actually works. Measure it for a few sprints first. Then you'll have real data when you're like "hey, why does our testing always bottleneck?" Seen teams literally halve their cycle time just fixing one persistent slowdown.
Honestly, keeping your team happy in Scrum is everything. Happy developers just code better - I've watched teams completely fall apart when morale goes to shit. You can track this stuff through retros, quick surveys, or even those cheesy mood boards (though they actually work). The real trick isn't collecting the data though. It's doing something about it when satisfaction starts dropping. Short sprints make burnout happen fast, so dig into the why during your next retrospective. Adjust how you're working together. Trust me, velocity and quality will follow once people actually want to be there.
Look, tracking lead times is honestly a game changer for hitting your sprint goals. You'll spot bottlenecks way faster when you see how long stuff actually takes from start to finish. Most teams I know struggle with scope creep or too much work in progress - that's what kills your timelines. If stories keep taking double your estimates, your refinement process probably needs work. We had this happen on my last project and it was brutal. Short bursts of measuring this data will show you patterns pretty quick. Then you can fix your planning before the next sprint goes sideways.
Your team needs to agree on what "done" actually means and stick to the same story point scale. Don't change up your team members mid-sprint either - that'll mess everything up. Here's the thing though: velocity isn't about speed, it's just for planning capacity. I'd track it for like 6-8 sprints minimum to see any real patterns. Focus on finishing complete user stories instead of leaving stuff half-done. And honestly? Don't let anyone use it as some weird performance scorecard to pressure people.
So when your planned vs actual numbers don't match up, you gotta dig into the retrospective and figure out what went sideways. Maybe your story estimates sucked, or some random blocker blindsided everyone - happens all the time. Don't just ignore it though (guilty as charged on that one). Take those insights and actually use them for next time. Adjust how you calculate velocity, break stories down differently, maybe build in some buffer for those annoying dependencies. Honestly, I've learned way more from the sprints that went off the rails than the perfect ones. Track these patterns so you'll spot the same issues creeping up again.
Numbers don't tell the whole story, honestly. Your velocity looks great but maybe your team's stressed or rushing through code reviews. I've seen teams hit every sprint goal while secretly hating their jobs. Burndown charts won't show you if people feel safe bringing up problems. Sometimes perfect metrics just mean everyone's too scared to rock the boat. Are stakeholders actually happy with what you're shipping? Hard to tell from a dashboard. You really need those one-on-ones and retros to figure out what's actually going on behind the scenes.
Track satisfaction scores right alongside your velocity and sprint goals. After each sprint review, throw in a quick feedback loop - most teams totally blow this off but it's actually super useful. I'd create a stakeholder satisfaction metric measuring if features actually solve their problems, not just check boxes. Response time for feedback matters too. Make their input part of your retros so you're measuring real value, not just story points. Even something basic like a 1-10 survey after demos works great to start.
Honestly, just pick 2-3 metrics that actually show if you're hitting your goals. Review them every few sprints during retros - don't just set and forget. I've watched teams obsess over velocity while shipping buggy code, which is totally backwards. Your priorities will shift (they always do), so be ready to ditch metrics that aren't useful anymore. Oh, and define what you're actually trying to accomplish first - otherwise you're just measuring random stuff. Treat them like tools in your toolbox, not some sacred numbers you have to worship.
Track your velocity trends - when tech debt piles up, you'll see story points delivered start dropping even though everyone's working just as hard. Super annoying, right? Also watch how much sprint capacity goes to bug fixes vs new features. I'd start measuring cycle time for similar stories too, since that'll creep up. Oh, and track how often you're reopening "done" work because of shortcuts. Honestly, retrospectives are perfect for capturing this stuff. Build a simple dashboard showing velocity alongside these debt indicators so your PO actually sees what technical shortcuts cost you long-term.
So beyond your normal velocity stuff, track async communication patterns and timezone coverage - that's huge for remote teams. Time to first response on tickets matters way more when you can't just walk over to someone's desk. Story completion times across different zones tell you a lot too. Oh and definitely check retrospective participation rates. Some people just go quiet on video calls, you know? Ceremony effectiveness across locations is another big one. Start with maybe 2-3 of these metrics first - don't overwhelm yourself trying to measure everything at once.
-
“I've always gotten excellent slides from them and the customer service is up to the mark.”
-
Nice and innovative design.