


Scrum Metrics Sprint Performance Dashboard


Try Before you Buy Download Free Sample Product
 Impress Your
 Audience
Editable
of Time


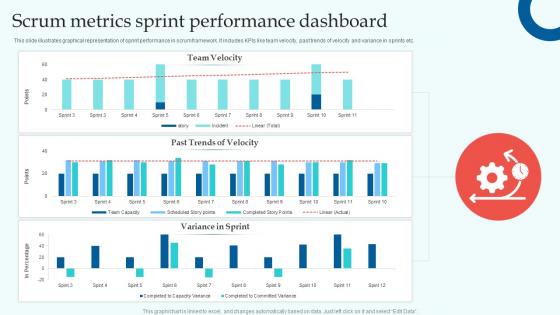
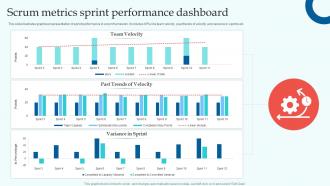
This slide illustrates graphical representation of sprint performance in scrum framework. It includes KPIs like team velocity, past trends of velocity and variance in sprints etc.
This slide illustrates graphical representation of sprint performance in scrum framework. It includes KPIs like team velocity, past trends of velocity and variance in sprints etc. Introducing our Scrum Metrics Sprint Performance Dashboard set of slides. The topics discussed in these slides are Team Velocity, Past Trends Of Velocity, Variance In Sprint. This is an immediately available PowerPoint presentation that can be conveniently customized. Download it and convince your audience.
People who downloaded this PowerPoint presentation also viewed the following :
Scrum Metrics Sprint Performance Dashboard with all 7 slides:
Use our Scrum Metrics Sprint Performance Dashboard to effectively help you save your valuable time. They are readymade to fit into any presentation structure.


Most Relevant Reviews
-
Thank you for showering me with discounts every time I was reluctant to make the purchase.
-
Unique research projects to present in meeting.