


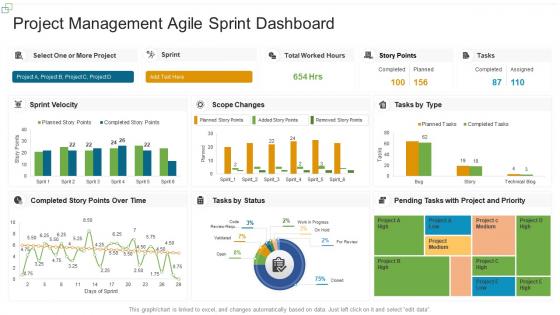
Project management agile sprint dashboard





Try Before you Buy Download Free Sample Product
 Impress Your
 Audience
 100%
100% Editable
 Save Hours
 of Time


Our Project Management Agile Sprint Dashboard are topically designed to provide an attractive backdrop to any subject. Use them to look like a presentation pro.
People who downloaded this PowerPoint presentation also viewed the following :
Project management agile sprint dashboard with all 7 slides:
Use our Project Management Agile Sprint Dashboard to effectively help you save your valuable time. They are readymade to fit into any presentation structure.






FAQs for Project management
Honestly, just track these five things: sprint burndown to see if you're gonna hit your deadline, team velocity (average story points per sprint), how you're doing on your sprint goal, and completed vs committed story points. Cycle time for individual tasks is clutch too - seriously reveals where things get stuck. Don't go crazy with a million charts though, that's just visual clutter. The whole point is knowing in real-time whether you'll actually finish what you planned and what's blocking you. I'd start here and only add more metrics if your team will genuinely use them to make decisions.
Dude, visual sprint data is a game changer. Progress bars show story point completion way better than boring number tables. I always use color-coded cards - green for done, red for blocked, you know the drill. Burndown charts? They'll tell you instantly if you're screwed or on track. Kanban boards are perfect for real-time flow tracking. Throw in some pie charts to break down effort by category too. Here's the thing - your brain processes visuals like 60x faster than text, so you'll spot bottlenecks before they blow up. Simple icons work great for status indicators.
So burndown charts are basically your sanity check for how much work is left versus time. Look at yours every day during standup - you'll spot if you're on track or completely screwed. They're great for catching scope creep early, plus they force those awkward but necessary conversations with stakeholders about realistic timelines. The "ideal" line shows perfect steady progress, but honestly? Real sprints look like a hot mess most of the time. Don't stress about the bumps - just watch for concerning trends and adjust before things get totally out of hand.
I always start our stand-ups by screen sharing the dashboard - saves so much time. Everyone can see sprint progress and who's doing what without digging through their notes. The visual layout makes it obvious when tasks are stuck or someone needs help. We just walk through each swim lane together and call out any blockers. Way better than the old days when people would be like "umm, what did I do yesterday again?" Plus you'll spot if you're behind on sprint goals pretty fast. Takes maybe 2 minutes but gets everyone aligned.
**Jira** is probably your best bet - yeah, it can be overwhelming at first, but there's a reason everyone uses it. **Azure DevOps** works great if you're in a Microsoft environment. Want something dead simple? **Trello** gets the job done without all the bells and whistles. You could get fancy with **Tableau** or **Power BI** for dashboards, or even hack something together in **Notion** if you're into that. But honestly? Start with whatever your devs are already comfortable with. Nobody wants to learn yet another tool they'll probably ignore anyway.
Honestly, it's a game changer - no more "wait what's happening with that thing again?" every five minutes. Your dashboard shows real-time progress and who's stuck on what. Those painful standups where everyone looks lost? Way less awkward now. You'll catch bottlenecks early instead of scrambling later. Plus people can see when teammates need help without the weird dance of actually asking for it. Just make sure it auto-updates or nobody will trust it. Nothing worse than stale data making everyone second-guess the whole system.
Look, real-time data is like having a constant health check on your sprint. You'll catch issues early instead of finding out during retro that everything went sideways. I learned this the hard way - nothing worse than discovering your team was stuck for days while you were blissfully unaware. When blockers start stacking up or your burndown chart goes flat, you can actually do something about it. Check your dashboard every morning (seriously, make it a habit) and call quick huddles when things look weird. Your team will thank you for catching scope creep before it murders your sprint goals.
Start with business value and dependencies - that's your foundation. Quick wins are gold, so grab those high-value, low-effort stories first. Dependencies will mess you up if you're not careful though. Can't have Story B starting when it needs Story A finished, right? Color-coding by priority helps a ton, and I'm obsessed with those little dependency arrows between stories. Makes the critical path super obvious. Your team won't have to guess what comes next, which honestly saves everyone's sanity during sprints.
Check your dashboard's historical data before planning - it's a game changer for setting realistic targets. Past sprint completion rates show you exactly what your team can handle (not what you hope they can handle). Story point accuracy tells you where you're being way too optimistic with estimates. We're all guilty of that. Look for patterns in where work gets stuck too - certain task types always take forever and you'll spot the bottlenecks coming. Your actual throughput beats wishful thinking every time, so match your sprint planning to what the data shows instead of crossing your fingers.
Only track what actually matters - sprint progress, blockers, velocity. Stuff that changes how your team works. Don't get sucked into tracking everything just because the tool lets you (I've been there lol). Keep it to 5-7 visuals tops. Use the same colors consistently and group similar things together so you're not scanning everywhere. Hide completed tasks or shove them somewhere else. Here's my test: if you can't figure out sprint health in 30 seconds on a Friday afternoon when your brain's toast, it's too busy. Simple beats comprehensive every time.
Honestly, treat your dashboard like it's alive - check in with your scrum masters every few months to see what's actually useful. When teams start using new stuff like SAFe or whatever DevOps thing they're into now, you'll need to tweak your metrics. I follow some Agile people on Twitter (probably spend too much time there) but it helps catch trends. The worst thing is building something cool then never touching it again. Short bursts work better than long sentences sometimes. Set up quarterly reviews to make sure you're tracking things that matter to how teams really operate day-to-day.
Honestly, most people just throw way too much stuff on one screen and it becomes overwhelming. Nobody wants to look at 15 different charts every morning. Stick to maybe 3-5 metrics that actually matter for decisions. Also avoid vanity metrics - like who cares about story points without any context? Show trends instead of random numbers. I've seen dashboards that look super fancy but take forever to load... totally defeats the purpose. Oh and don't track stuff just because you can - that's how you end up with dashboard graveyard where nobody checks it anymore. Keep it fast and simple.
Just throw a feedback section right on your sprint dashboard - most tools have custom widgets for this stuff. Track the status (got it/reviewed/done), priority levels, and link them to specific sprint items. Honestly? Start with a messy but visible feedback backlog that everyone can see. Better than perfect organization that takes forever to set up. You can also drop feedback straight into user stories as comments. Main thing is keeping client input out of those email black holes where devs never see it. Pick one method and try it for a sprint - you'll figure out what works.
Daily updates work best - grab 5 minutes during standup or right after. Just hit the basics: story statuses, any blockers, burndown chart refresh. Don't overthink it though. I've watched teams spend forever tweaking colors and formatting when literally nobody cares. Consistency matters way more than having some gorgeous dashboard. Pick a time and actually stick to it (not Friday at 4pm when you're brain-dead). Fresh data means your team won't second-guess everything. You'll spot problems early instead of scrambling mid-sprint.
Honestly, shared dashboards are a game-changer for cross-functional teams. Everyone can see sprint progress in real-time without those soul-crushing status meetings. When dev work starts piling up but testing lags behind, you'll spot it right away and move people around. There's something satisfying about the whole team watching those green checkmarks pile up together too. Your designers, devs, and testers start catching dependencies before they become headaches. Just make sure you set up auto-updates - nothing worse than making decisions off stale data. We use it as our go-to during standups now.
-
Understandable and informative presentation.
-
Great experience, I would definitely use your services further.