In the fast-paced world of project management, keeping track of progress is vital to delivering high-quality results, on time. This is where sprint burndown charts come in. They are a staple in project management, visually representing a team's progress toward completing a project.
As a project progresses, keeping track of the numerous tasks can become challenging. Sprint burndown charts track the progress of a project and identify areas that require attention. They provide real-time visibility into how much work is left to be completed, how fast the team is working, and whether they are on track to meet their goals. This makes them an essential component of Agile Project Management, where sprints are used to deliver value to the customer in digestible parts.
As a professional involved in project development, you are likely familiar with sprint burndown charts. However, finding a suitable template to meet your needs can be daunting. SlideTeam proudly introduces the Top 5 Sprint Burndown Chart Templates with examples and samples that you can download which fulfill your professional goals whether as a project manager, developer, product owner, or team leader.
A clear view of progress helps identify issues in advance, so they can be addressed before they become major problems. These templates ensure that any roadblocks are identified and addressed promptly by visualizing the remaining effort, remaining tasks, scope tasks, and completed tasks.
Each template has unique features that cater to specific project needs. For instance, the first template is ideal for tracking remaining efforts, while the fourth template offers a comprehensive overview of the team's performance, including the average sprint velocity, and sprint goal completion percentage.
If you want to elevate your project management game, our pre-designed PowerPoint slides are the ultimate weapon in your arsenal. These templates are tailored to meet your needs, from tracking completed tasks to monitoring team velocity.
With a download of one of these templates, you'll have access to a wealth of structured, content-ready slides that are fully customizable to your needs. So why wait? Download one of these templates today and start managing your tasks like a pro!
Check Out Our Top 5 Sprint Burndown Chart Templates
Template 1: Sprint Burndown Chart with Remaining Efforts
This template shows the remaining efforts and tasks required to complete the tasks in a given sprint. It allows you to track progress against an ideal burndown line, representing the amount of work that should be completed, along with some critical insight that can be noted. Streamline your project management and impress stakeholders with our downloadable template today!
Template 2: Sprint Burndown Complexity Chart with Task Status
This PPT Slide provides a detailed view of the sprint burndown chart by showing the complexity of the remaining tasks and their status. It gives daily figures on backlog items, efforts, time, and tasks and helps you deliver valuable insights on task scope and ideal remaining tasks. This enables the team to identify any roadblocks and adjust their approach accordingly. Unleash the full potential of your team with our detailed template - download now and impress your audience!
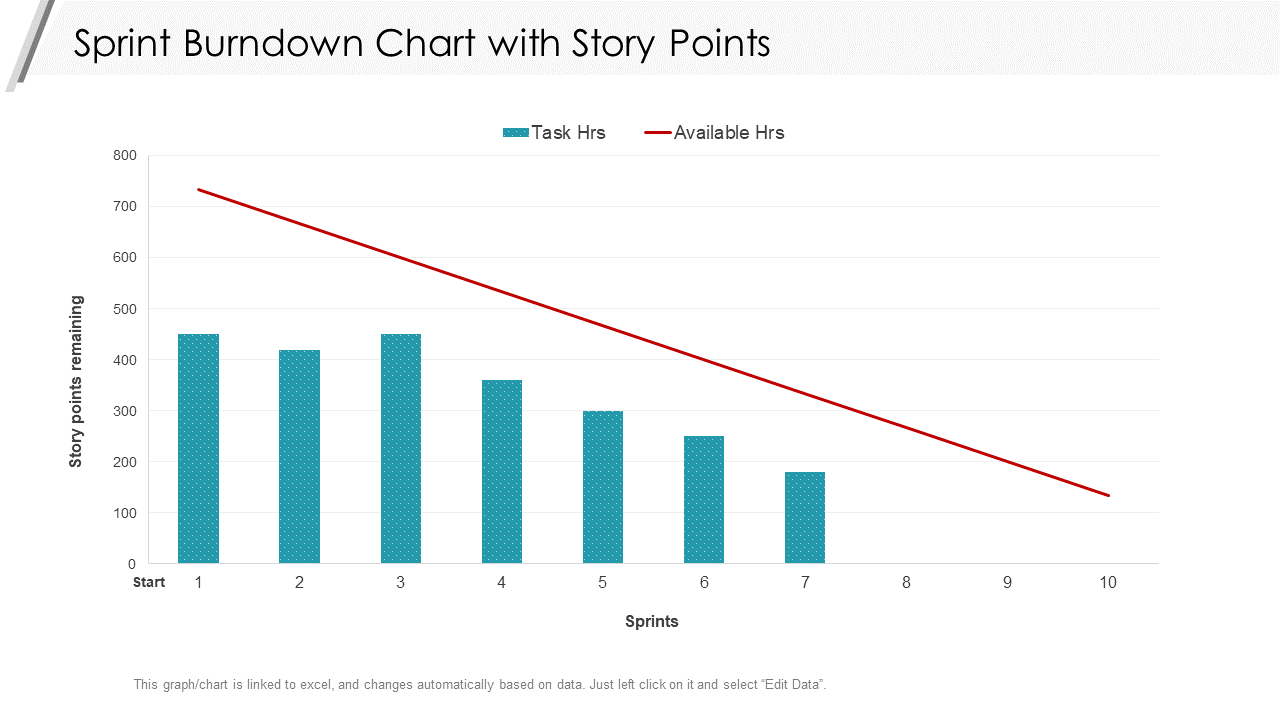
Template 3: Sprint Burndown Chart with Story Points
This PPT Layout is a valuable tool that helps teams estimate task effort and track progress against an ideal burndown line based on estimated story points. This template uses these story points to estimate the effort required to complete a task. It depicts the actual tasks hours and the available hours. Maximize your team's productivity with our user-friendly chart template - download now and take your project to the next level!
Template 4: Scrum Metrics with Sprint Burndown Chart
This template illustrates additional scrum key performance metrics (KPIs) for individual sprints, such as team velocity, story points, bugs, completed tasks, remaining tasks, burndown charts, and statistics. This provides a more comprehensive view of the team's progress and helps identify critical areas requiring attention. Download now and better understand your team's progress with the charts in this template!
Template 5: Sprint Burndown Chart Representing Team Velocity System Integration Plan PPT Professional Demonstration
This PowerPoint Template is ideal for larger software projects where multiple teams work together. The team velocity/efforts chart in this slide is an excellent for software implementation management, providing a clear visual representation of the total work remaining and the probability of achieving the implementation goal. It enables you to track the progress of each task under the allocated time and their contribution to the overall project. It can be used to facilitate productive discussions and guide decision-making related to software implementation progress and management. Download and optimize your software project management with valuable insights and visual representation.
THE WAY FORWARD
Sprint burndown charts are crucial for any project team. They are the best way to make the progress transparent to the product owner and stakeholders, so they can see how the team is doing and adjust course as needed. They provide real-time visibility into the progress of a sprint and help the section to alter the course as required.
Using the above sprint burndown chart templates ensures that your team is on track to deliver high-quality results, on time. So, don't hesitate to download and use these templates for your next project.
For more top Scrum project management templates with samples and examples, check out SlideTeam's blog post here.
FAQs on Sprint Burndown Chart
What is sprint Burndown in Agile?
Sprint burndown is an essential Agile metric that helps in tracking the progress of a sprint by depicting the amount of work remaining against time. It is a chart that displays the remaining effort or the total work that remains to be completed in a sprint against the elapsed time.
How is sprint burndown calculated?
Sprint burndown is calculated by plotting the ideal burndown, which is the anticipated rate of progress, against the actual progress made by the team. To calculate the sprint burndown, the team needs to create a sprint backlog that lists all the tasks and requirements to be completed in the sprint. The remaining effort for each job is estimated in hours or story points, depending on the team's preference. The total remaining attempt for all the tasks is then calculated and plotted on the y-axis of the sprint burndown chart.
The ideal burndown line is then plotted on the chart, indicating the anticipated rate of progress for the sprint. This line is drawn from the starting point of the sprint and ends at the anticipated completion point, with the slope indicating the rate of progress.
As the sprint progresses, the actual progress made by the team is recorded, and the remaining effort is updated accordingly. This information is plotted on the sprint burndown chart, showing the actual burndown line. If the real burndown line is above the ideal one, the team is behind schedule. The team is ahead of schedule if the existing line is below the ideal line.
How do you read a sprint burndown chart?
To read a sprint burndown chart, you must focus on the remaining effort on the y-axis and time on the x-axis. The chart starts with the initial remaining effort for the sprint, which is usually based on the scope of tasks that the team aims to complete. As the team completes the tasks, the remaining effort decreases, and the line on the chart goes down. If the team is ahead of schedule, the actual burndown line will be below the ideal one, indicating they are completing tasks faster than anticipated. Conversely, if the existing line exceeds the ideal line, the team is falling behind schedule.


 Customer Reviews


