

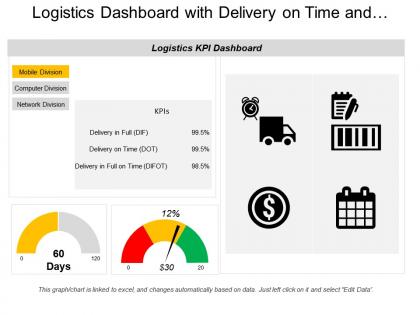
Logistics dashboard with delivery on time and quarter to date




Try Before you Buy Download Free Sample Product
 Impress Your
 Audience
 100%
100% Editable
 Save Hours
 of Time


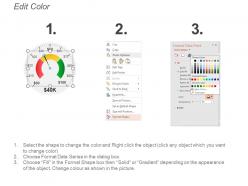
Logistics Key Performance Metrics PowerPoint template helps in illustrating performance measurement that is usually used by logistics managers to keep a track, visualize, as well as optimize all relevant logistic processes in a most efficient and transparent way. Among others, these measurements refer to transportation, supply chain aspects, and warehouse. The Delivery Time Dashboard presentation slide helps in keeping the track of the time that needed for an order to get prepared properly and to arrive at the destination. A user can take help of Delivery on Time PPT template to set a benchmark of delivery time. When a benchmark gets set, then a business manager has an idea of the average delivery time from the warehouse to the destination. With the help of Logistic Delivery Time Dashboard slide, Sales Manager can discuss with his team that their goal would be to reduce the delivery time till it is possible. A user can discuss special delivery services offered by the organization with the client by taking help of Delivery Dashboard PPT template. He can also discuss the special delivery service idea with his team but ask them to precise it too. A user can use Quarter to Date PowerPoint slide to inform the approximate delivery time to his customers. Looking for something convenient to use? Our Logistics Dashboard With Delivery On Time And Quarter To Date are always near at hand.
People who downloaded this PowerPoint presentation also viewed the following :
Logistics dashboard with delivery on time and quarter to date with all 6 slides:
Awaken dormant capability with our Logistics Dashboard With Delivery On Time And Quarter To Date. No assignment is too daunting for them.

FAQs for Logistics dashboard with delivery on time and
Honestly, I'd start with the basics - on-time delivery, order accuracy, and inventory turnover. Those three tell you most of what you need to know. Lead times and fill rates are huge too since they catch problems before they blow up. Your dashboard needs real-time freight tracking and warehouse capacity stuff. Oh, and supplier performance metrics - can't believe how many people skip that one. Customer satisfaction scores matter obviously, but don't go crazy with too many KPIs. Stick to maybe 5-7 max or your team won't even look at it.
Dude, real-time data integration is a game changer for logistics dashboards. Instead of looking at old info, you're seeing shipments and inventory levels update live. Spot problems right when they happen, not hours later when you're screwed. It's like GPS vs that crusty atlas your dad still keeps in the glove compartment - actually useful! You can jump on issues before they blow up. Honestly, the difference between being proactive and just scrambling to catch up is huge. Start with whatever data changes the most throughout your day.
Logistics dashboards are make-or-break when your team's racing against time to make decisions. Cluttered interfaces or buried data? You're basically sabotaging your own people. I've watched way too many "impressive" dashboards become paperweights in actual operations. Design for real workflow first - put the critical stuff front and center, make navigation dead simple. Oh, and those alerts better be screaming loud when something goes wrong. Here's the thing though: test it with actual operators, not just designers. What makes perfect sense to you might confuse the hell out of someone pulling a night shift.
So predictive analytics is pretty cool - it basically shows you what's gonna go wrong before it actually does. You can see demand spikes coming, figure out when machines might crap out, spot delivery issues weeks ahead. Way better than the usual panic mode, right? Instead of scrambling for trucks or dealing with pissed off customers, you're already adjusting routes and scheduling maintenance. Honestly, it feels like cheating sometimes. I'd say start with something simple like delivery predictions first, then expand from there once you get the hang of it.
Build different views for different people first - warehouse folks want inventory numbers and fulfillment stuff, while executives just need the big picture KPIs and cost breakdowns. Let people dig deeper when they want to, but keep the main dashboard clean. Colors help (just don't make it look like a kids' cereal box). Your most important metrics should hit you right away when you open it. Oh, and definitely add those customizable widget things so teams can move around what they actually care about. Test it with real people before you launch - seriously, they'll spot issues you completely missed.
So basically, get everyone looking at the same data instead of passing around random spreadsheets like it's 1995. Real-time access to shipment info and inventory levels cuts down those annoying "where's my stuff?" calls by like 90%. When problems pop up, you'll catch them faster and actually work together instead of the usual blame game. Honestly, automated alerts are a game-changer - partners get notified automatically when delays happen. Start with whatever metrics your key partners actually give a damn about, then build from there.
So AI/ML for predictive stuff is huge right now - totally changes how you can forecast issues. Real-time IoT sensors are everywhere too, giving you actual visibility instead of guessing. Cloud setups that don't crash when you scale? Game changer. AR overlays sound weird but they're legit helpful for warehouse picking routes. Digital twins let you test changes without breaking everything first - honestly wish more companies used this. Edge computing fixes those annoying delays when you need data fast across different locations. I'd probably just audit what you're missing first.
Logistics dashboards are game-changers for tracking delivery times, route efficiency, fuel costs, and how well you're using your vehicles. Real-time visuals make spotting bottlenecks so much easier before they snowball into major headaches. Honestly, we should've started using ours way earlier! Patterns in your transportation data will jump out at you - super helpful for optimizing routes and cutting down empty miles. Oh, and set up alerts when performance dips below targets. That feature saves so much stress. Don't go crazy with metrics at first though. Pick 3-4 core ones to start.
Data standardization will drive you crazy - trucks, ships, trains, air freight all speak different languages basically. Ocean freight updates once a day while truckers ping GPS every few minutes. Each carrier has their own API too, which is fun. It's honestly like trying to get a bunch of toddlers to sit still sometimes. Your visibility's gonna be spotty at first, no way around it. Focus on nailing down the same KPIs across everything and get decent middleware that can translate between all these systems. Trust me on this one.
Dude, visualization tools are a game changer for logistics data. Those endless spreadsheets become actual charts and heat maps that make sense. You'll spot delivery delays and capacity problems instantly instead of scrolling through hundreds of shipment records like some kind of masochist. Interactive dashboards let you click around and dive into specific routes or time periods. Bar charts work great for comparisons, line graphs for trends, maps for geographic stuff - though honestly I always mess up which chart type to use at first. Pick your most important KPIs and start building visuals around those.
Honestly, start with automated checks that catch bad data before it hits your reports. Pull from one reliable source per metric - seriously, nothing's worse than three different inventory numbers confusing everyone. Do weekly spot-checks against what's actually happening on the ground. Someone needs to own each data stream, otherwise accountability goes out the window. Map out where your discrepancies usually pop up first though - that's your priority list right there. Oh, and document your current sources so you're not guessing where problems come from later.
Look, dashboards are game-changers for catching supply chain disasters before they blow up. You'll see delayed shipments and inventory shortages in real-time instead of finding out when it's too late. Set up automated alerts for stuff that actually matters to your business - not random metrics nobody cares about. When something goes sideways, you can instantly reroute shipments or switch suppliers. It's honestly like having superpowers for logistics, which sounds dramatic but isn't wrong. Small problems stay small instead of becoming expensive nightmares.
Dude, having mobile access to your logistics dashboard is honestly a lifesaver. When shipments get delayed or you're running low on inventory, you don't have to sprint back to the office. I've literally rerouted deliveries while waiting in line at Starbucks. Real-time tracking, approving orders, messaging your team - it's all right there. Problems get fixed in minutes instead of sitting there for hours getting worse. Your customers stay happy, operations don't fall apart. Seriously, grab the mobile app if you haven't yet.
Honestly, just track your costs before and after - that's the easiest way to show ROI. Look at shipping expenses, delivery delays, inventory costs, all that stuff. Manual labor hours too since dashboards usually cut those way down. One company I heard about slashed their reporting time by like 70% which is nuts. Revenue side matters as well - happier customers, faster orders, that kind of thing. Compare everything against what you spent on the dashboard over maybe 12-18 months. Oh, and definitely get your baseline numbers now before you implement anything, otherwise you'll be kicking yourself later trying to prove it worked.
Honestly, the biggest thing right now is interactive drill-downs - people want to click a number and instantly see what's behind it instead of jumping around different reports. Real-time alerts are massive too, especially when shipments go sideways. Mobile-responsive is finally becoming standard (seriously, took forever). AI insights that actually explain WHY things happened, not just the what, are pretty cool. Oh and dashboards are getting way more conversational - less static charts, more dynamic stuff you can actually talk to. My advice? Figure out what "what if" questions your team asks most and bake those right into the design from the start.
-
Presentation Design is very nice, good work with the content as well.
-
Amazing product with appealing content and design.