Transportation kpi dashboard showing cost and on time final delivery
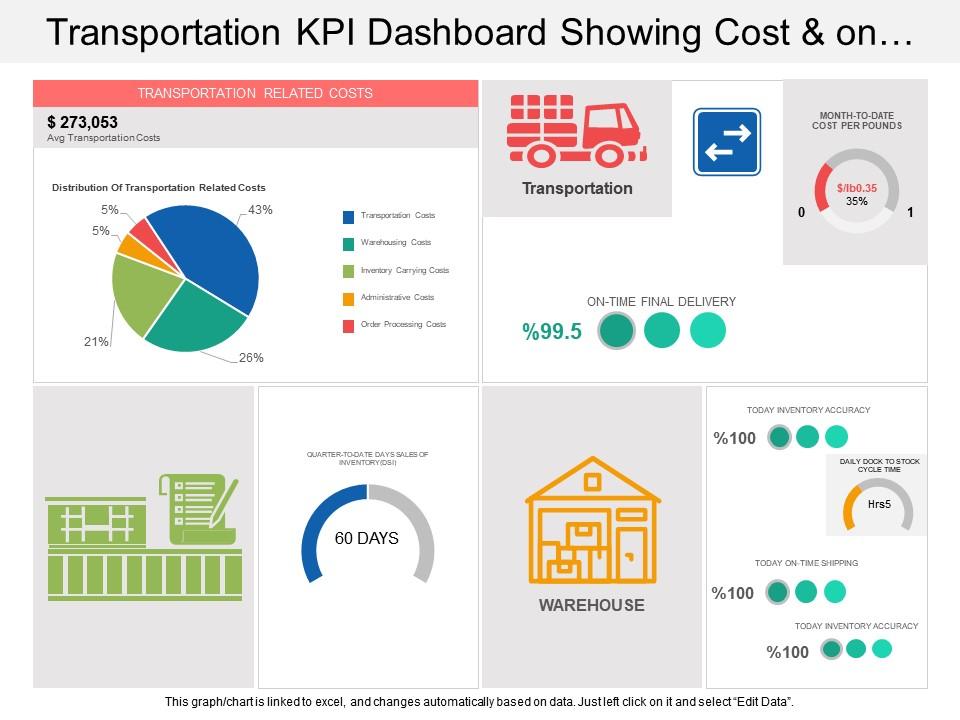
Download our transportation KPI dashboard showing cost and on time final delivery PPT slide. This presentation slide of KPI of transportation management has been created by our professional team and useful to view various activities involved in Transportation Company such as getting quotes for transportation services, cutting the cost of transport services, showing cost and on time delivery. This PowerPoint sample slide can be used to review reducing waste in the supply chain, to build an agile supply chain or to ensure quality in purchasing and supply chain impact. With the help of this agile supply chain management KPI PPT slideshow you can show how your supply chain is the process that moves products from suppliers to you and then on to your customer’s .Use this slide of supply chain to review various factors involved in this process such supplier manufacturing facility, modes of transport, warehouses management and production lines. Our Transportation Kpi Dashboard Showing Cost And On Time Final Delivery are like designer labels. They will put a stamp on your brand of thought.
Download our transportation KPI dashboard showing cost and on time final delivery PPT slide. This presentation slide of KPI..
- Google Slides is a new FREE Presentation software from Google.
- All our content is 100% compatible with Google Slides.
- Just download our designs, and upload them to Google Slides and they will work automatically.
- Amaze your audience with SlideTeam and Google Slides.
-
Want Changes to This PPT Slide? Check out our Presentation Design Services
- WideScreen Aspect ratio is becoming a very popular format. When you download this product, the downloaded ZIP will contain this product in both standard and widescreen format.
-

- Some older products that we have may only be in standard format, but they can easily be converted to widescreen.
- To do this, please open the SlideTeam product in Powerpoint, and go to
- Design ( On the top bar) -> Page Setup -> and select "On-screen Show (16:9)” in the drop down for "Slides Sized for".
- The slide or theme will change to widescreen, and all graphics will adjust automatically. You can similarly convert our content to any other desired screen aspect ratio.
Compatible With Google Slides

Get This In WideScreen
You must be logged in to download this presentation.
PowerPoint presentation slides
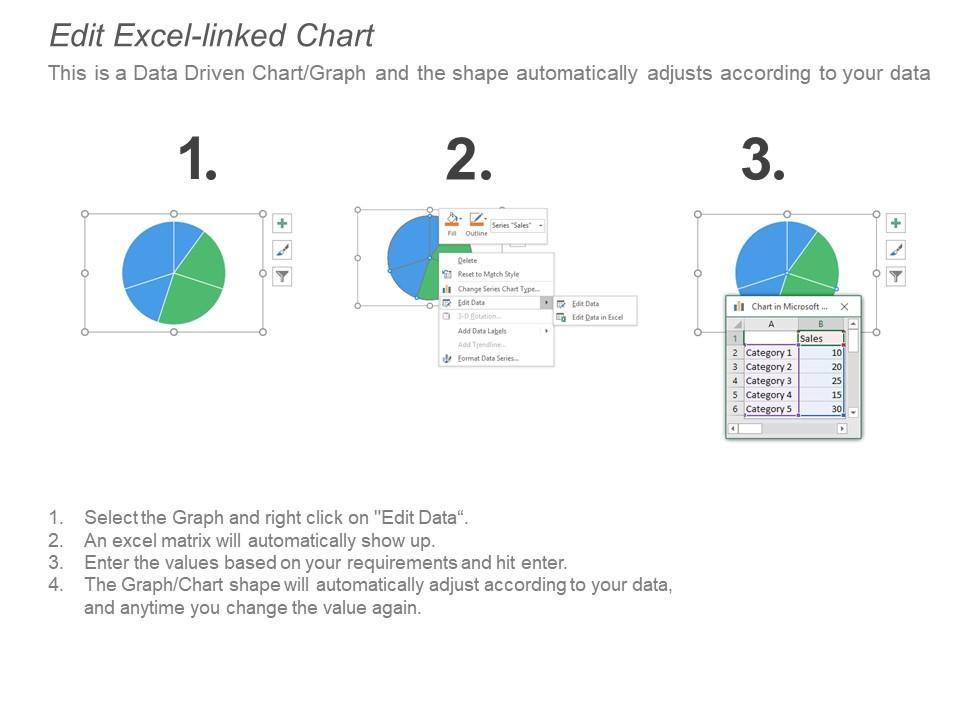
Presenting transportation KPI dashboard showing cost and on time final delivery PPT slide. This deck offers you plenty of space to put in titles and sub titles. This template is Excel linked just right click to input your information. High resolution based layout, does not change the image even after resizing. This presentation icon is fully compatible with Google slides. Quick downloading speed and simple editing options in color text and fonts.PPT icons can easily be changed into JPEG and PDF applications.
People who downloaded this PowerPoint presentation also viewed the following :
Content of this Powerpoint Presentation
Description:
The image is a PowerPoint slide titled "Transportation KPI Dashboard Showing Cost & on-time final delivery," designed to provide key performance indicators (KPIs) for transportation logistics. The slide is organized into several sections, each presenting different data points:
1. Transportation Related Costs:
Showcases an average cost figure prominently at the top, indicating the average transportation costs, with a comparison to previous periods to show change over time.
2. Distribution of Transportation Related Costs:
A pie chart breaks down costs into categories such as Transportation Costs, Warehousing Costs, Inventory Carrying Costs, Administrative Costs, and Order Processing Costs.
3. Month-to-Date Cost per Pounds:
Displays a gauge chart that represents the cost per pound for the current month, with a target range indicated.
4. On-Time Final Delivery:
Illustrates a percentage of on-time deliveries, signaling the efficiency of the transportation process.
5. Quarter-to-Date Days Sales of Inventory (DSI):
Uses a gauge chart to show the number of days that inventory has been sold in the current quarter.
6. Today Inventory Accuracy:
Features two percentages – one for the day's inventory accuracy and another for on-time shipping, complemented by a cycle time indicator for the dock to stock process.
Additionally, the slide includes a footer note stating that the graph/chart is linked to Excel and updates automatically based on data, suggesting interactivity and real-time data integration.
Use Cases:
This transportation KPI dashboard is versatile and can be utilized across various industries that require logistics and inventory monitoring for operational efficiency.
1. Logistics:
Use: Tracking and optimizing transportation costs and delivery efficiency
Presenter: Logistics Manager
Audience: Supply Chain Team, Management
2. Retail:
Use: Managing inventory levels and cost efficiency for retail distribution
Presenter: Inventory Specialist
Audience: Retail Management, Financial Analysts
3. Manufacturing:
Use: Monitoring product transportation costs and efficiency from factory to distributors
Presenter: Supply Chain Director
Audience: Manufacturing Team, Distributors
4. E-commerce:
Use: Analyzing shipping costs and delivery performance for e-commerce orders
Presenter: E-commerce Operations Manager
Audience: Customer Service Teams, Stakeholders
5. Pharmaceuticals:
Use: Ensuring timely delivery and cost management of sensitive pharmaceutical products
Presenter: Pharmaceutical Logistics Coordinator
Audience: Healthcare Providers, Regulatory Bodies
6. Automotive:
Use: Overseeing the distribution costs and delivery timelines of automotive parts and vehicles
Presenter: Automotive Supply Chain Manager
Audience: Dealerships, Production Managers
7. Agriculture:
Use: Streamlining the transportation costs and schedules for agricultural products
Presenter: Farm Operations Manager
Audience: Distributors, Agricultural Business Owners
Transportation kpi dashboard showing cost and on time final delivery with all 6 slides:
Ensure immediate attention with our Transportation Kpi Dashboard Showing Cost And On Time Final Delivery. Catch their eye from the beginning.
No Reviews


